ii Index: Q2 2026
ii customers give a masterclass in retail investing
Our customers have seen 59% portfolio growth over six and a half years - despite market volatility.

Important information: As investment values can go down as well as up, you may not get back all the money you invest. Currency changes affect international investments, and this can decrease their value in sterling. If you’re unsure if an investment account is right for you, please speak to an authorised financial adviser. Tax treatment depends on your individual circumstances and may be subject to change in the future. Please note images displayed are for illustrative purposes only.
What is the ii Index?
interactive investor has published its latest instalment of the ii Index, providing data and insights on how the everyday retail investor is performing and positioning their portfolios in this ever-changing market. The ii Index covers all accounts across ISA, Trading Account, and SIPP.
Portfolios on the interactive investor platform once again outperformed the IA Mixed Investment 40–85% Shares sector – this time by more than 10%, as ii the average ii customer has seen their portfolio grow an impressive 59.1% since January 1 2020, compared to the 49% from the benchmark.
The sector can be a useful comparator for private investor portfolios, given its mix of bonds, cash, and shares.
ii investors deliver impressive performance
“Naturally, we don’t place lots of emphasis on short-term performance given the nature of investing, however - even over one-year, interactive investor customers have outperformed the professional benchmark.
The average customer portfolio on interactive investor has grown almost 60% since we first launched this ii index. That is seriously impressive.
We hope this data continues to demonstrate that investing can be straightforward; that it’s possible to grow your money with consistent habits and a well-diversified portfolio.”
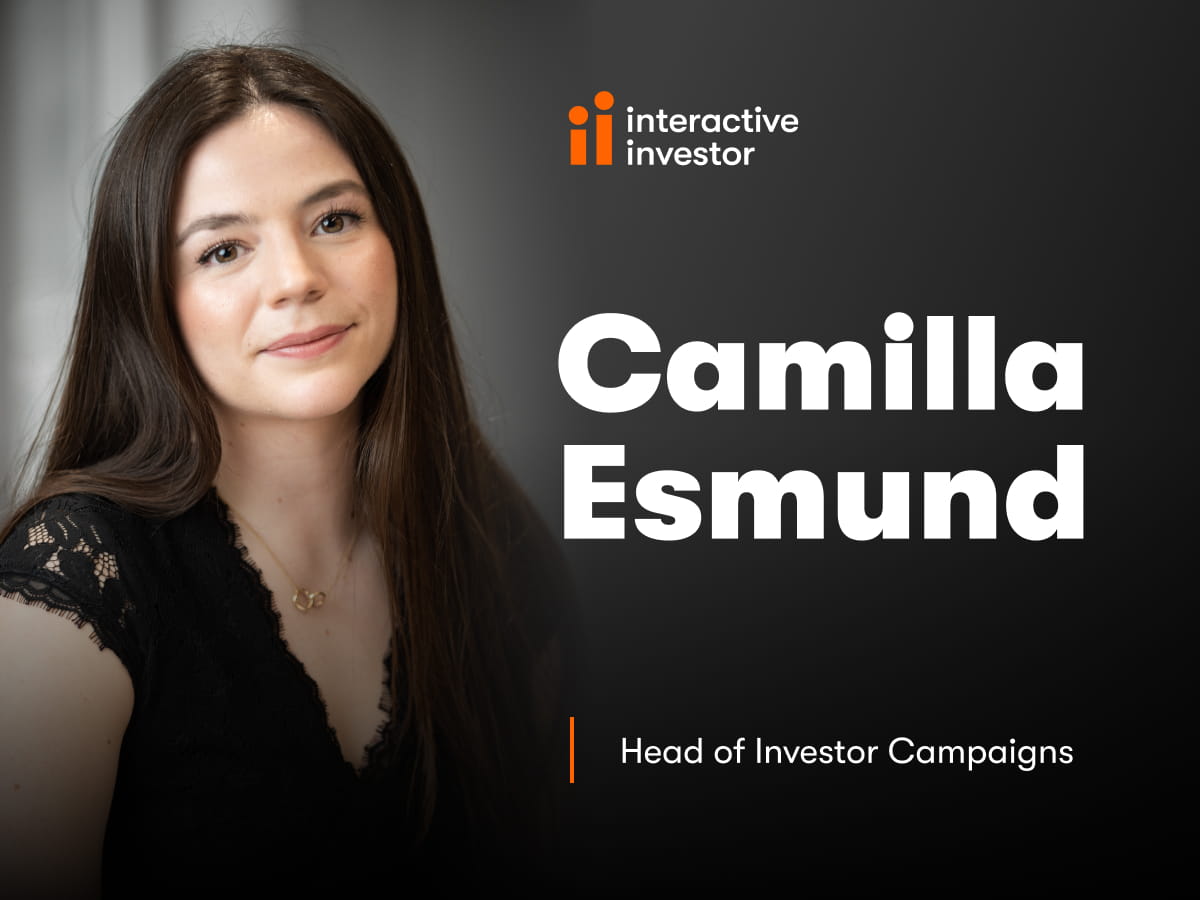
Camilla Esmund, Head of Investor Campaigns
How customers invest: the age breakdown
Over the full 6 and a half years that we have measured this data, the 35-44 age group recorded the highest portfolio growth, closely followed by 45-54-year-olds.
This is particularly impressive as these age ranges are in one of the most financially demanding periods of their lives, in their mid-life.
| 6.5 years | 5 years | 4 years | 3 years | 2 years | 1 year | |
|---|---|---|---|---|---|---|
| 18-24 | 59.8% | 35% | 57.9% | 47.7% | 29.1% | 21.1% |
| 25-34 | 61.7% | 36.1% | 56.5% | 45.9% | 26.8% | 18.6% |
| 35-44 | 63.4% | 40% | 56.6% | 47.6% | 29.2% | 20.4% |
| 45-54 | 62.8% | 41.7% | 56.9% | 48.3% | 30.1% | 20.7% |
| 55-64 | 59.5% | 41.1% | 54.9% | 47.2% | 29.5% | 19.4% |
| 65+ | 56.6% | 40.8% | 53% | 46.1% | 29.3% | 19.1% |
How customers invest: the key trends
ETFs have grown in popularity yet again – now making up 13% of customer portfolios, up from 12% last quarter. They are most popular among those aged 25-34, where they make up almost one quarter (24%) of their portfolios.
Allocations to equities have slightly lowered this quarter, down from 32% last quarter to 30%. There also continues to be a large gap in the way that our oldest and youngest investors hold equities – as they make up only 18% of portfolios of our youngest investors (18-24) compared to 37% for our oldest investors (65+).
Funds also make up a large part of portfolios – up to 29% on average compared to 28% last quarter. They are most popular with our youngest investors, making up over one third (34%) of their portfolios.
| Age Band | Cash | Shares | ETFs | Funds | Investment Trusts | Other |
|---|---|---|---|---|---|---|
| 18-24 | 9.2% | 18.1% | 18.1% | 33.9% | 17.5% | 3.2% |
| 25-34 | 8.2% | 17.9% | 23.6% | 31.9% | 12.6% | 5.8% |
| 35-44 | 7.9% | 21.1% | 23.4% | 33.2% | 7.4% | 7% |
| 45-54 | 8.2% | 25.8% | 18.4% | 33.6% | 8.1% | 5.9% |
| 55-64 | 8.2% | 28% | 13.6% | 32.7% | 12.4% | 5.1% |
| 65+ | 7.7% | 37.3% | 7.1% | 22.7% | 22.4% | 2.8% |
| Avg. | 8% | 30.2% | 13.2% | 29% | 15.1% | 4.5% |

Hear from the experts
ii’s Fund Research team share their insights on where investors might position their portfolios.
In the latest ii Index, they dive into real assets, strategic bonds, and global equity income strategies.
View previous ii Index reports
View or download previous instalments of the ii Index.
Discover more original research and reporting

ii SIPP Index
The ii SIPP Index reveals how interactive investor SIPP pension savers invest during their working life and in retirement.

Great British Retirement Survey
One of the largest retirement surveys of its kind, with research conducted for ii by Opinium Research.

2026 Investment Outlook
Our experts analyse the major talking points for investors and share their investment ideas for the future.

ii Top 50 Fund Index
Our ii Top 50 Fund Index ranks the most-popular funds, investment trusts and exchange-traded funds (ETFs) in each quarter.

Get in touch
If you would like to speak to one of our spokespeople or if you would like bespoke content from our expert writers, please contact:
Saffron Wainwright
PR Manager
Email: saffron.wainwright@ii.co.uk