Will IAG ascend to a new flight level?
Independent analyst Alistair Strang reveals what the charts say might happen next for the British Airways owner.
26th February 2025 08:23
by Alistair Strang from Trends and Targets

We last reviewed International Consolidated Airlines Group SA (LSE:IAG) last August and in the period since the share price has reached our primary, secondary, and even third-level targets.
It even exceeded our third-level target, perhaps giving some considerable hope for the future.
- Invest with ii: Top UK Shares | Share Tips & Ideas | Cashback Offers
It’s perhaps worth pondering a few truisms from the stock market first, especially as IAG is managing to make two contradictory statements true at once with a third thrown in for good measure and confusion.
The first issue occurs when we review the immediate picture on the chart. IAG has enjoyed a nice uptrend since November last year, but earlier this month it broke the uptrend and is now experiencing “lower low” movements, creating a situation where weakness continuing below 321p is liable to promote reversals to an initial 299p with our secondary, if broken, at a bottom ideally just above 276p.
This would certainly provide an ideal level for a bounce, although there is always the risk of the share simply exhibiting further weakness. After all, in the market place, few things are as dangerous as trying to catch a “safe” bottom when loss of confidence in a share price makes it very easy for sentiment to influence folks’ decision-making, with the result that a downhill path can become a bad habit.
Visually, in the case of IAG, we’d hope to see our initial target level of 299p to provide a “bottom” due to previous behaviour indicating that this price level means something to the market. This scenario is certainly one for the brave, although it does afford employing a tight stop loss.
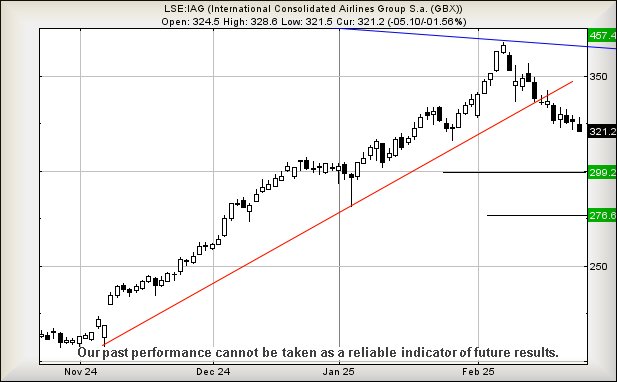
Source: Trends and Targets. Past performance is not a guide to future performance.
However, there’s another movement earlier in February worth weaving into our thoughts. The share price somehow managed to define a downtrend since the pre-pandemic high of 2020, creating a situation where any movement now above the blue downtrend (currently 361p) is liable to prove quite useful.
It introduces the potential of a rise to an initial 457p with our longer-term secondary, if bettered, calculating at a distant but viable-looking 579p, should the share price manage above our initial target. This scenario is made more fascinating due to the market belatedly noticing the completely artificial green line on the chart. For some reason, when the price surged to 368p in February, the market eventually noticed the prior high of 361p achieved in 2020, deciding that this would make a perfect “glass ceiling” level and forcing a stall in the share price increase.
We are certainly fascinated at the coincidence of both the green and blue lines creating what passes for a safe trigger level. As a result, we suspect this will deserve some attention in the weeks/days ahead, just in case the airline decides to ascend to a new flight level. It certainly starts to appear as though IAG will be worth keeping an eye on.
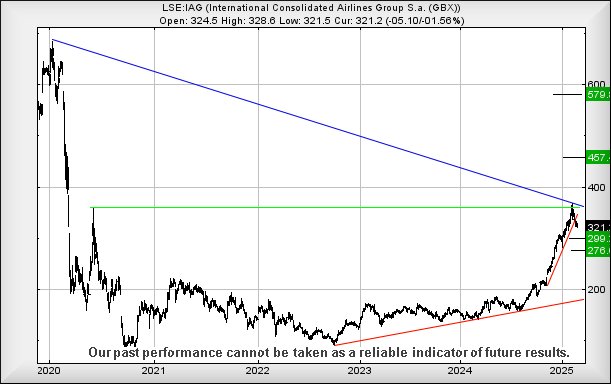
Source: Trends and Targets. Past performance is not a guide to future performance.
Alistair Strang has led high-profile and "top secret" software projects since the late 1970s and won the original John Logie Baird Award for inventors and innovators. After the financial crash, he wanted to know "how it worked" with a view to mimicking existing trading formulas and predicting what was coming next. His results speak for themselves as he continually refines the methodology.
Alistair Strang is a freelance contributor and not a direct employee of Interactive Investor. All correspondence is with Alistair Strang, who for these purposes is deemed a third-party supplier. Buying, selling and investing in shares is not without risk. Market and company movement will affect your performance and you may get back less than you invest. Neither Alistair Strang or Interactive Investor will be responsible for any losses that may be incurred as a result of following a trading idea.
These articles are provided for information purposes only. Occasionally, an opinion about whether to buy or sell a specific investment may be provided by third parties. The content is not intended to be a personal recommendation to buy or sell any financial instrument or product, or to adopt any investment strategy as it is not provided based on an assessment of your investing knowledge and experience, your financial situation or your investment objectives. The value of your investments, and the income derived from them, may go down as well as up. You may not get back all the money that you invest. The investments referred to in this article may not be suitable for all investors, and if in doubt, an investor should seek advice from a qualified investment adviser.
Full performance can be found on the company or index summary page on the interactive investor website. Simply click on the company's or index name highlighted in the article.