Why this fund investor just switched into cash
After quickly spotting which way the wind was blowing, Saltydog analyst battened down the hatches.
2nd March 2020 12:47
by Douglas Chadwick from ii contributor
This content is provided by Saltydog Investor. It is a third-party supplier and not part of interactive investor. It is provided for information only and does not constitute a personal recommendation.
After quickly spotting which way the wind was blowing, Saltydog analyst battened down the hatches.

Global markets suffer a major correction
This time last week I wrote about Unit Trusts and OEICs investing in the US. I pointed out that the S&P 500 and the Nasdaq had both set new all-time highs the previous week and were adding to the significant gains that we had seen in 2019. Last year, the S&P went up 29% and the Nasdaq did even better, gaining 35%.
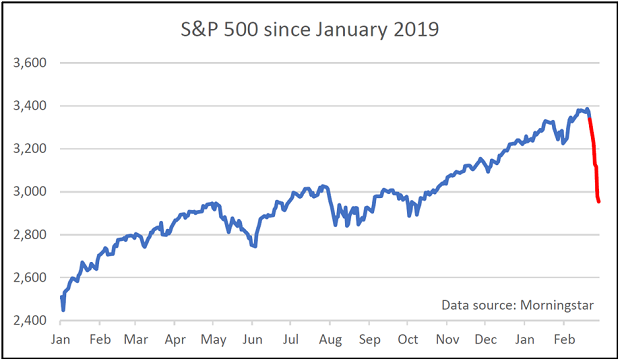
The blue line on the graph below shows the performance of the S&P 500 up until the close of play on Friday 21st February. My observation at the time was that “It’s not all been plain sailing, but overall there’s been a strong upward trend”.

Past performance is not a guide to future performance
The red line shows what has happened since then.
A market correction is often defined as a decline of 10% from the latest 52-week high. They’re not that uncommon but they normally take several weeks to develop, if not longer. What is unusual is that the S&P 500 has just done it in a week.
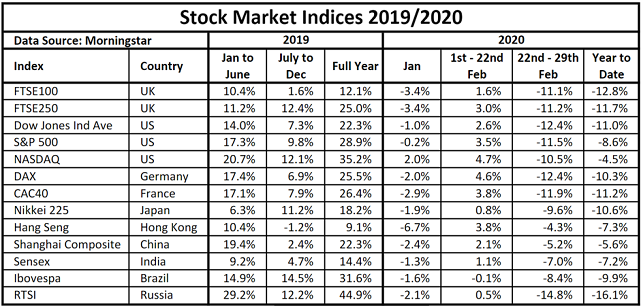
Other stock markets around the world have also seen significant falls.

Past performance is not a guide to future performance
The UK FTSE 100 fell 11% last week and is now lower than it was at the end of 2018.
Overnight, Asian markets picked up and the FTSE 100 started the day ahead of where it closed on Friday. Does this mean that the storm has passed, or is it merely a temporary lull? Well, London had given back all its gains by lunchtime, so uncertainty and volatility remain the order of the day.
As momentum investors we don’t predict what we think will happen to the markets, but react to what is actually happening.
By the middle of last week we could see which way the wind was blowing, and so in the Saltydog demonstration portfolios we reduced our exposure to the markets. Cash now accounts for over 65% of our total investment.
Later this week we will decide whether we batten down the hatches for a little longer, or step back into the markets.
For more information about Saltydog, or to take the 2-month free trial, go to www.saltydoginvestor.com.
These articles are provided for information purposes only. Occasionally, an opinion about whether to buy or sell a specific investment may be provided by third parties. The content is not intended to be a personal recommendation to buy or sell any financial instrument or product, or to adopt any investment strategy as it is not provided based on an assessment of your investing knowledge and experience, your financial situation or your investment objectives. The value of your investments, and the income derived from them, may go down as well as up. You may not get back all the money that you invest. The investments referred to in this article may not be suitable for all investors, and if in doubt, an investor should seek advice from a qualified investment adviser.
Full performance can be found on the company or index summary page on the interactive investor website. Simply click on the company's or index name highlighted in the article.