We own one India fund, but are keeping an eye on three others
Saltydog Investor considers how key stock markets performed in June, and explains that he’s closely monitoring the performance of a sector in a rich vein of form.
2nd July 2024 13:13
by Douglas Chadwick from ii contributor

This content is provided by Saltydog Investor. It is a third-party supplier and not part of interactive investor. It is provided for information only and does not constitute a personal recommendation.
Last week, the two leading Indian stock market indices set new record highs.
The BSE Sensex 30 closed above 79,000 for the first time and the Nifty 50 went above 24,000.
- Invest with ii: What is a Managed ISA? | Open a Managed ISA | Transfer an ISA
The Sensex is the primary benchmark index of the Indian stock market, acting as a barometer for the Indian economy. Launched in 1986, it comprises 30 of the largest and most actively traded stocks on the Bombay Stock Exchange (BSE).
These companies are selected based on market capitalisation, liquidity, revenue, and industry representation. The index covers various sectors of the Indian economy, including finance, information technology, energy, consumer goods, healthcare, and more, making it a comprehensive indicator of the market's overall performance.
The Nifty 50, introduced 10 years later, is the benchmark index of the National Stock Exchange of India (NSE). It includes 50 of the largest and most liquid stocks, many of which are also included in the Sensex. With more stocks, the Nifty 50 offers a slightly more diversified view of the market than the Sensex and tends to be slightly less volatile.
Leading companies that feature in both indices include Reliance Industries Ltd GDR - 144A (LSE:RIGD), Tata Consultancy Services,HDFC Bank Ltd ADR (NYSE:HDB), Infosys Ltd ADR (NYSE:INFY) and ICICI Bank Ltd ADR (NYSE:IBN).
- Are there reasons to be bullish on India after shock election result?
- Top 10 most-bought investment funds in June 2024
So far this year, the Sensex has risen by 9.4%, while the Nifty 50 is up 10.5%.
Although their overall progress has been impressive, both indices fell sharply at the beginning of last month. On 4 June, the Sensex went down by -5.7% and the Nifty 50 suffered a -5.9% one-day loss.
The results of the general election had just been announced and the Bharatiya Janata Party (BJP) had lost its outright parliamentary majority for the first time in 10 years. That is not what the exit polls had suggested.
The incumbent government had been very pro-business, and that was popular with investors who did not want anything to rock the boat. There was a concern that the economic recovery could be derailed.
However, Narendra Modi, the Indian prime minister, was able to form a coalition government and stock markets quickly recovered. The Sensex ended the month up 6.9%, while the Nifty 50 gained 6.5%.
We keep track of a dozen key stock market indicators. Despite a shaky start, the Sensex ended up being the best-performing one in June.
| Stock Market Indices | 2024 | ||||||
| Index | Country | January | February | March | April | May | June |
| FTSE 100 | UK | -1.3% | 0.0% | 4.2% | 2.4% | 1.6% | -1.3% |
| FTSE 250 | UK | -1.7% | -1.6% | 4.4% | 0.4% | 3.8% | -2.1% |
| Dow Jones Ind Ave | US | 1.2% | 2.2% | 2.1% | -5.0% | 2.3% | 1.1% |
| S&P 500 | US | 1.6% | 5.2% | 3.1% | -4.2% | 4.8% | 3.5% |
| NASDAQ | US | 1.0% | 6.1% | 1.8% | -4.4% | 6.9% | 6.0% |
| DAX | Germany | 0.9% | 4.6% | 4.6% | -3.0% | 3.2% | -1.4% |
| CAC40 | France | 1.5% | 3.5% | 3.5% | -2.7% | 0.1% | -6.4% |
| Nikkei 225 | Japan | 8.4% | 7.9% | 3.1% | -4.9% | 0.2% | 2.8% |
| Hang Seng | Hong Kong | -9.2% | 6.6% | 0.2% | 7.4% | 1.8% | -2.0% |
| Shanghai Composite | China | -6.3% | 8.1% | 0.9% | 2.1% | -0.6% | -3.9% |
| Sensex | India | -0.7% | 1.0% | 1.6% | 1.1% | -0.7% | 6.9% |
| Ibovespa | Brazil | -4.8% | 1.0% | -0.7% | -1.7% | -3.0% | 1.5% |
Data source: Morningstar. Past performance is not a guide to future performance.
This was also reflected in our latest sector analysis.
Most of the sectors we regularly report on went up in June, but there were some significant exceptions. The three UK equity sectors went down. UK All companies fell by 1.1%, UK Equity Income lost 1.2%, and UK Smaller Companies finished the month down 1.7%.
The European sectors also went down, as did North American Smaller Companies, and China/Greater China. However, the Latin America sector suffered the biggest loss, falling by 5.7%.
On a more positive note, the North America sector went up by 3.6%, as did Global Emerging Markets. Asia-Pacific excluding Japan rose by 4.1% and Technology & Technology Innovations made 6.4%.
The India/Indian Subcontinent sector beat them all, rising by 8.0%.
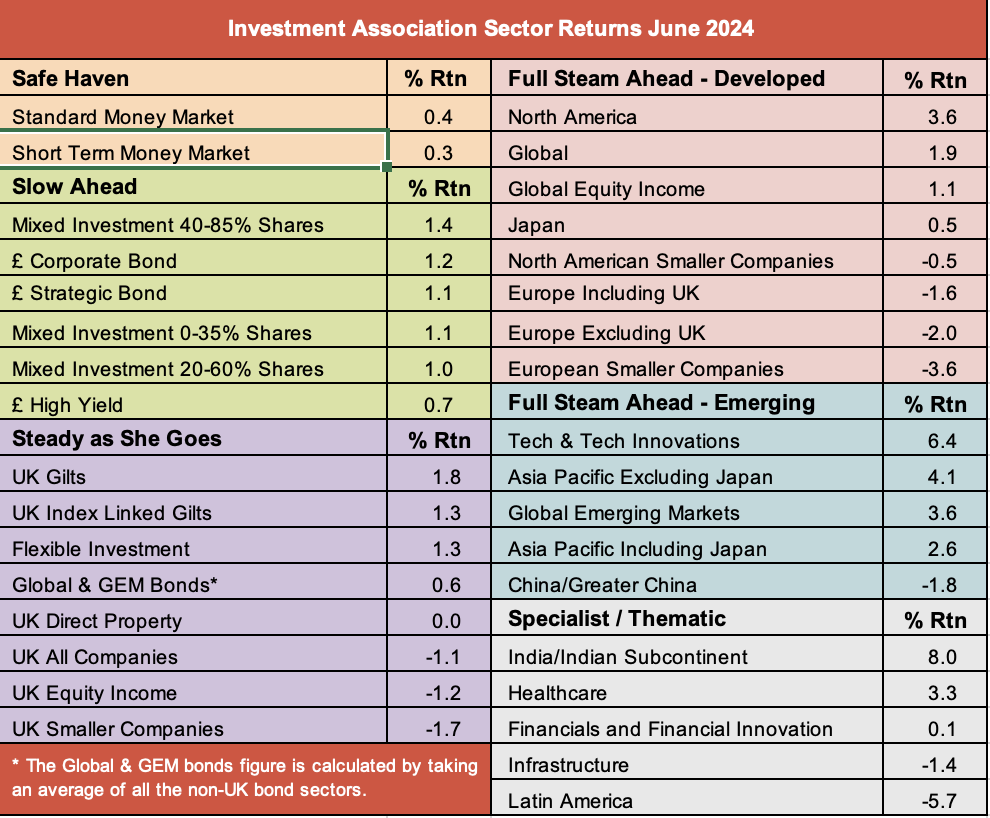
Data source: Morningstar. Past performance is not a guide to future performance.
In our regular weekly analysis, we track four funds from the India/Indian Subcontinent sector.
| 1-month return (%) | 3-month return (%) | 6-month return (%) | 12-month return (%) | |
| Jupiter India I Acc | 4.5 | 7.4 | 12.3 | 53.0 |
| Liontrust India C Acc | 7.4 | 9.1 | 22.9 | 37.7 |
| Stewart Investors Indian Subcontinent Sustnby | 11.1 | 14.9 | 18.8 | 24.5 |
| GS India Equity | 9.2 | 12.3 | 17.4 | 36.4 |
Data source: Morningstar. Past performance is not a guide to future performance.
As you can see, the Jupiter fund has done the best over the past year. This is a fund that we've held in our demonstration portfolios since the end of last August and we have been very happy with its performance.
It has had a couple of hiccups along the way, the most recent being at the beginning of June, but it has recovered and gone on to new all-time highs.
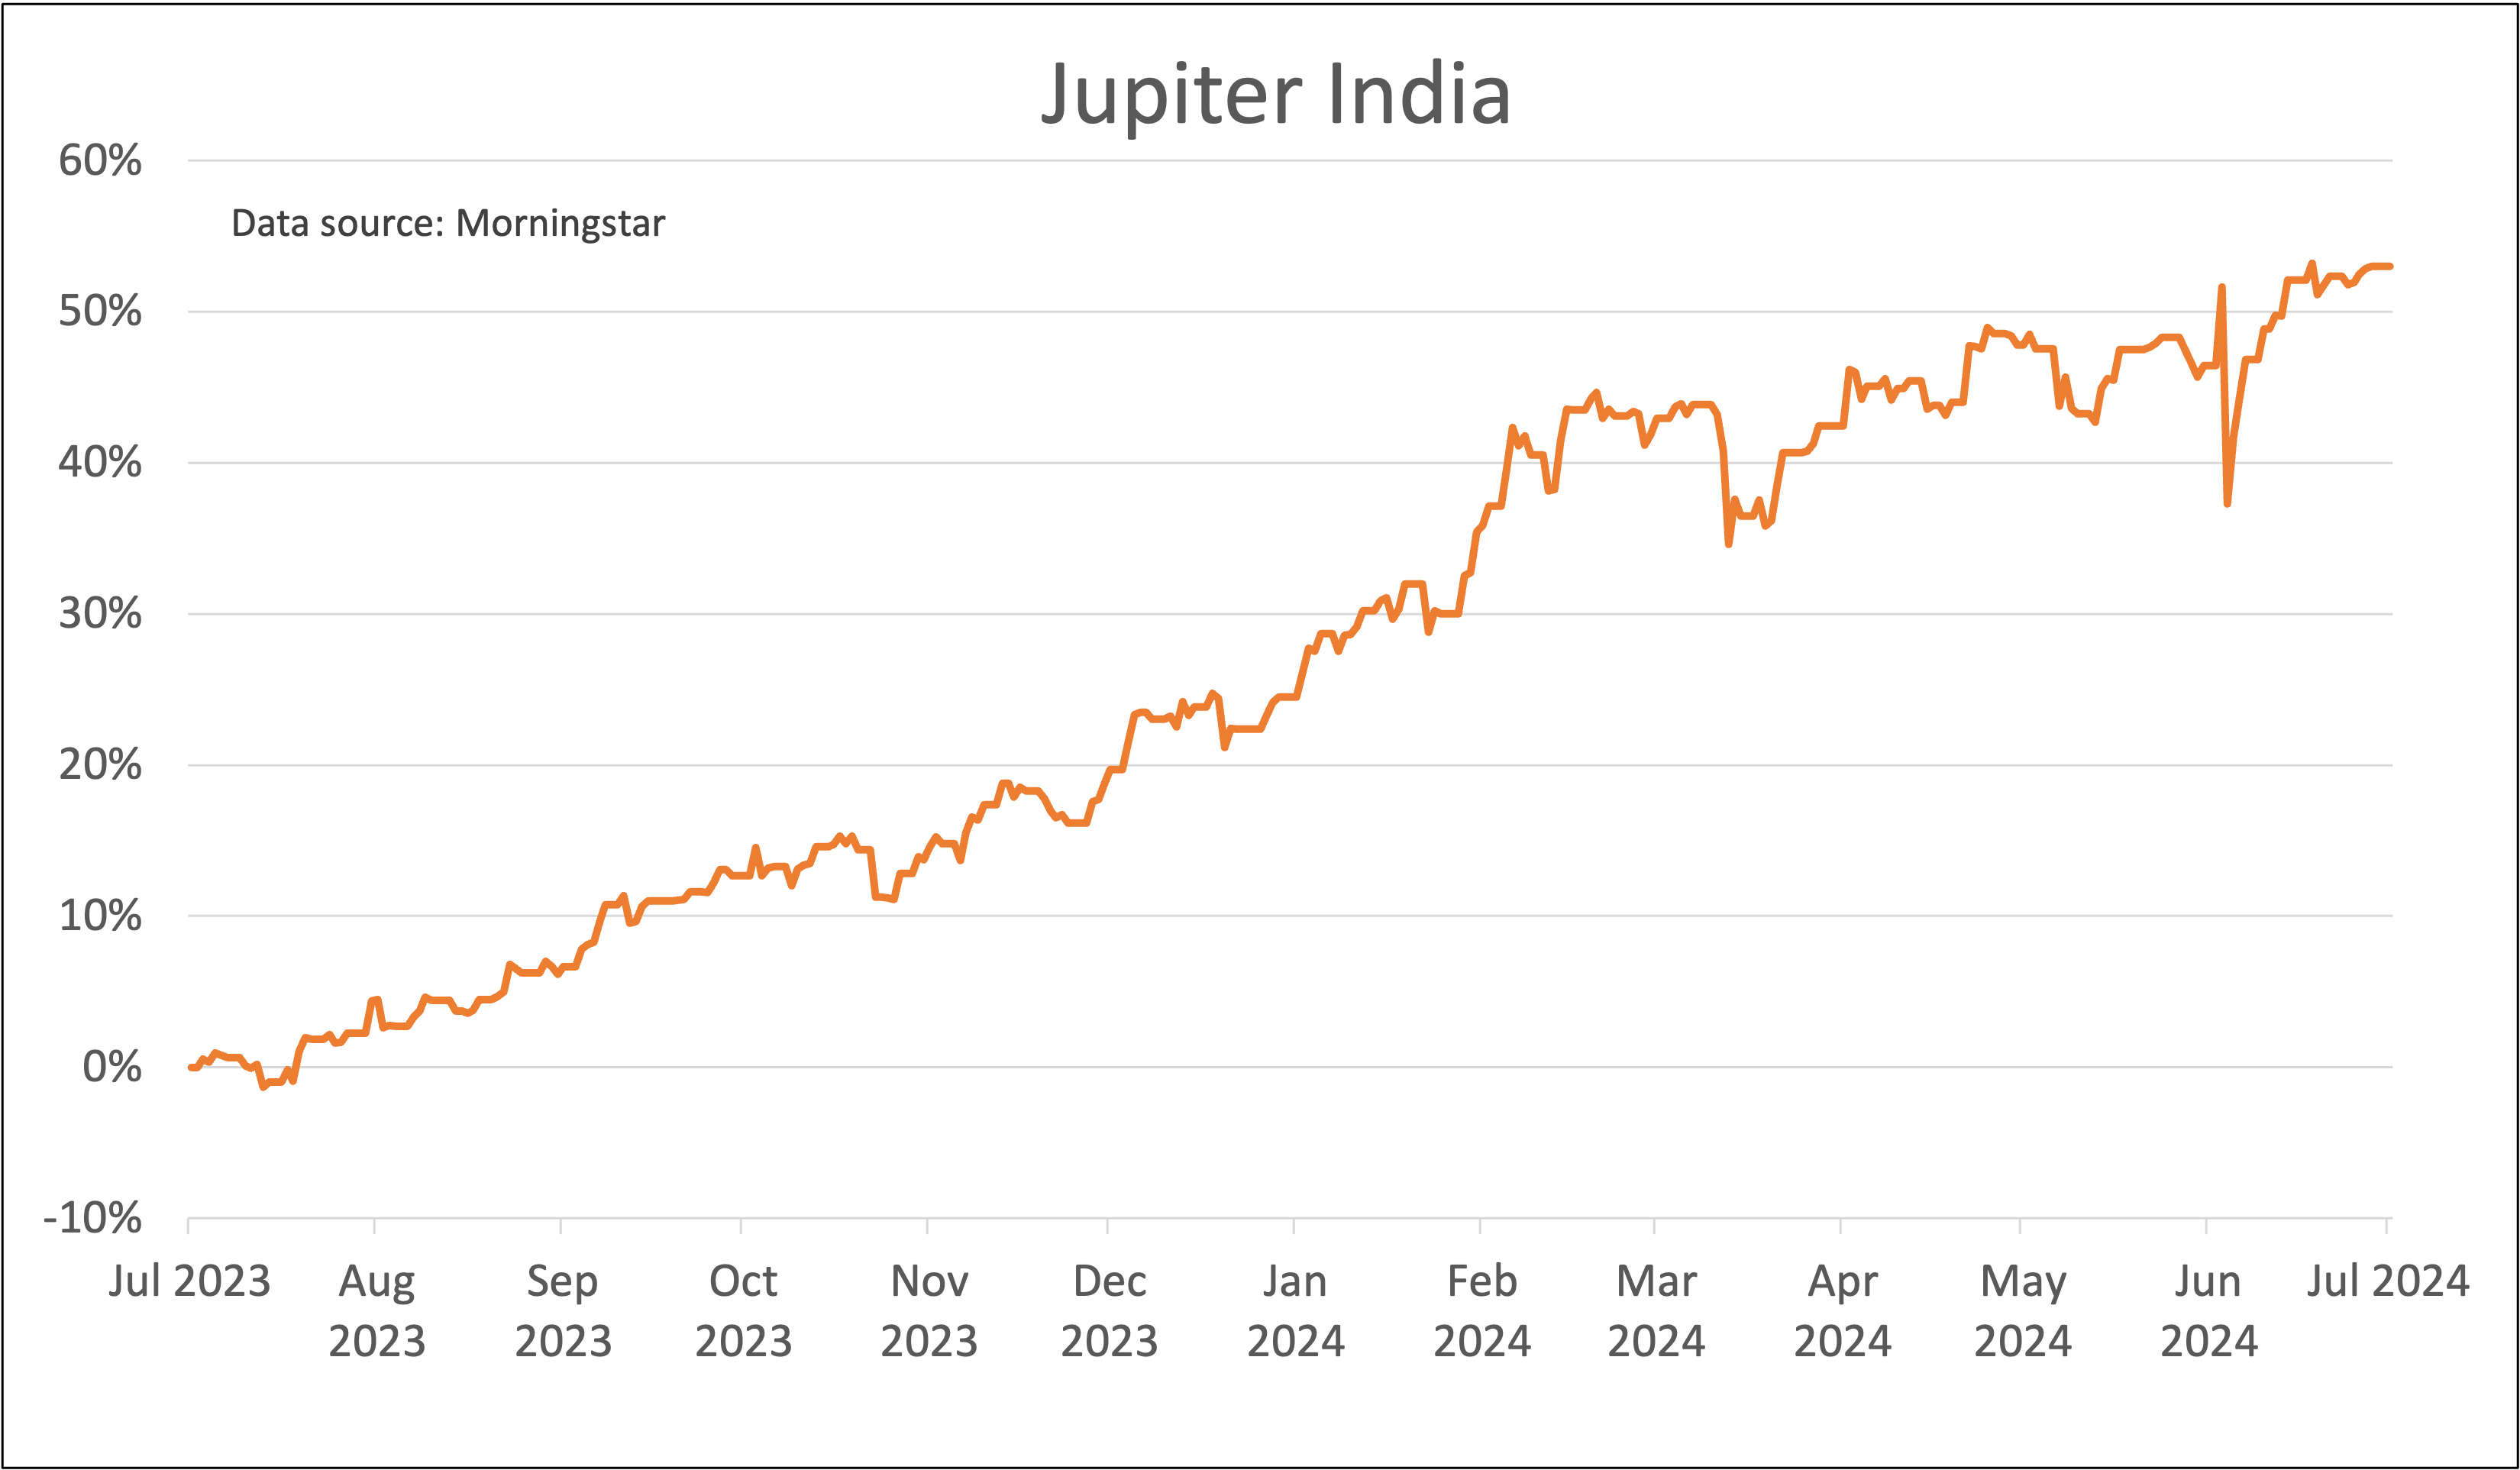
Data source: Morningstar. Past performance is not a guide to future performance.
In the past six months, the other three funds have started to catch up and the Stewart Investor India Subcontinent fund had a particularly strong June, gaining 11.1%.
We have resisted switching funds for the time being but are monitoring all four very closely.
For more information about Saltydog, or to take the two-month free trial, go to www.saltydoginvestor.com
These articles are provided for information purposes only. Occasionally, an opinion about whether to buy or sell a specific investment may be provided by third parties. The content is not intended to be a personal recommendation to buy or sell any financial instrument or product, or to adopt any investment strategy as it is not provided based on an assessment of your investing knowledge and experience, your financial situation or your investment objectives. The value of your investments, and the income derived from them, may go down as well as up. You may not get back all the money that you invest. The investments referred to in this article may not be suitable for all investors, and if in doubt, an investor should seek advice from a qualified investment adviser.
Full performance can be found on the company or index summary page on the interactive investor website. Simply click on the company's or index name highlighted in the article.