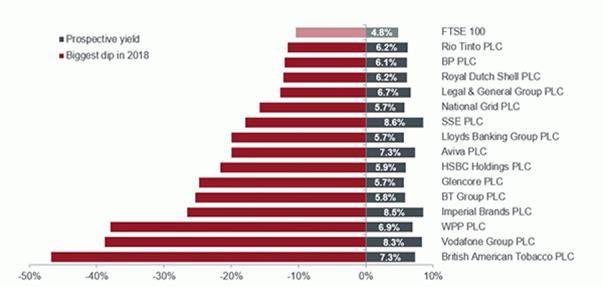
A must-see chart: Biggest FTSE 100 fallers, biggest dividend yields
4th December 2018 14:06
by Kyle Caldwell from interactive investor
A picture is often worth a thousand words. So are charts. Here Kyle Caldwell looks at what can be gleaned from this remarkable visual.

The UK stockmarket is currently loathed by both domestic and international investors, who have on the whole been giving UK equities the cold shoulder since June 2016 when the referendum on EU membership took place.
More than £10 billion of domestic retail investors' money has exited from UK equity funds since June 2016, with a large chunk having been redeployed into overseas businesses, global equity funds being the main beneficiaries. International investors have also been steering clear of the UK, despite the weak pound.
Nervousness over UK equities can also be gleaned in the chart below from Janus Henderson, which shows the big FTSE 100 dips in 2018. The chart shows companies in the FTSE 100 index that are over £10 billion in size, have a prospective dividend yield greater than 5% and have suffered a share price dip of over 10% in 2018. Overall, 15 blue-chip stocks meet these three criteria.
As the chart reveals, British American Tobacco, Vodafone Group and WPP have all suffered the biggest share price dips.
But, as far as income investors are concerned, the share price falls of these large-cap names have in turn boosted dividend yields, meaning that from an income perspective the shares have arguably become more attractive.
Big FTSE 100 dips in 2018
Click here for enlarged version of chart.

Source: Bloomberg, as at November 2018
Notes: Companies in FTSE 100 Index that are over £10 billion in size, have a prospective yield greater than 5% and have suffered a dip of over 10% since the end of 2017
This point was acknowledged by Paul O'Connor, head of the UK-based multi-asset team at Janus Henderson. O'Connor has been boosting his exposure to unloved UK equities, at the expense of US equities.
He explains:
"I have been selling the market that is loved and buying the market that is loathed. Sentiment towards UK equities is negative, everyone can see that in the price of sterling, and there have been some huge share price moves this year."
The high dividend yields on offer are a sign of potential value, but O'Connor notes that investors need to be careful as some of the 15 stocks in the chart will undoubtedly be value traps.
He adds that against a backdrop of "substantial Brexit risks" continuing to haunt markets, large-cap UK stocks are a safer way to play the UK, given that they are generally more internationally facing.
O'Connor also points out that the big companies have greater defensive characteristics compared to the mid and small cap firms found outside the FTSE 100 index.
"The FTSE 100 has a lot of defensive names and commodities. We are not prepared to back the mid and small caps at this stage and are instead focusing on the large caps that are not a play on the UK economy," says O'Connor.
Full performance can be found on the company or index summary page on the interactive investor website. Simply click on the company's or index name highlighted in the article.
This article was originally published in our sister magazine Money Observer, which ceased publication in August 2020.
These articles are provided for information purposes only. Occasionally, an opinion about whether to buy or sell a specific investment may be provided by third parties. The content is not intended to be a personal recommendation to buy or sell any financial instrument or product, or to adopt any investment strategy as it is not provided based on an assessment of your investing knowledge and experience, your financial situation or your investment objectives. The value of your investments, and the income derived from them, may go down as well as up. You may not get back all the money that you invest. The investments referred to in this article may not be suitable for all investors, and if in doubt, an investor should seek advice from a qualified investment adviser.
Full performance can be found on the company or index summary page on the interactive investor website. Simply click on the company's or index name highlighted in the article.