A look at what's next for Convatec Group
This FTSE 100 company has made an often volatile recovery from lows that followed Russia's invasion of Ukraine. Independent analyst Alistair Strang reveals what his charts might tell us about the future.
27th February 2025 07:17
by Alistair Strang from Trends and Targets

We’d very mixed feelings in 2023, when a political “Leave Russia” project kicked off, campaigning against companies such as ConvaTec Group (LSE:CTEC) who remained active in Russia despite events in Ukraine. When a company who lists among their activities in being a market leader in Advanced Wound Care, a political campaign to remove them didn’t sit well.
- Invest with ii: Open a Stocks & Shares ISA | ISA Investment Ideas | Transfer a Stocks & Shares ISA
A member of the FTSE 100, Convatec's share price has made a sufficient twitch to elicit a bunch of emails asking our opinion on what’s coming next?
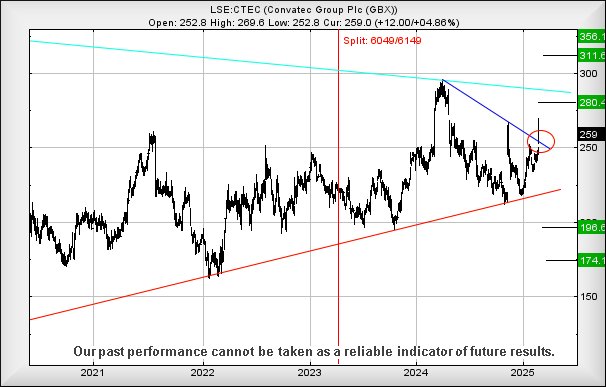
Well, the stock market has opted to “gap” the share price up above the Blue downtrend from a year ago, giving considerable hope that some good times can be anticipated in the near future. Should we choose to be a little cynical, we’ll not be surprised if the share price experiences near-term movement above 270p, triggering a jump upward to 280p and quite possibly a little higher.
Should the market follow the usual plotline, a lunge to even 290p can be expected but, invariably, the price shall experience some relaxation, despite intraday flamboyance actually closing the session below our initial target of 280p. But closure above 280p has the potential to trigger a power movement to 311p in the future. This could prove significant, especially as we’ve two quite different arguments favouring a future attraction as coming from a confident 356p.
If things intend to go wrong, the price needs to wander below 236p to make trouble, allowing us to project the danger of a drop down to a confident looking 196p as a hopeful bottom. If broken, our less likely secondary works out at 174p.
This is one where we suspect a convoluted upward cycle is expected.
Source: Trends and Targets. Past performance is not a guide to future performance.
Alistair Strang has led high-profile and "top secret" software projects since the late 1970s and won the original John Logie Baird Award for inventors and innovators. After the financial crash, he wanted to know "how it worked" with a view to mimicking existing trading formulas and predicting what was coming next. His results speak for themselves as he continually refines the methodology.
Alistair Strang is a freelance contributor and not a direct employee of Interactive Investor. All correspondence is with Alistair Strang, who for these purposes is deemed a third-party supplier. Buying, selling and investing in shares is not without risk. Market and company movement will affect your performance and you may get back less than you invest. Neither Alistair Strang or Interactive Investor will be responsible for any losses that may be incurred as a result of following a trading idea.
These articles are provided for information purposes only. Occasionally, an opinion about whether to buy or sell a specific investment may be provided by third parties. The content is not intended to be a personal recommendation to buy or sell any financial instrument or product, or to adopt any investment strategy as it is not provided based on an assessment of your investing knowledge and experience, your financial situation or your investment objectives. The value of your investments, and the income derived from them, may go down as well as up. You may not get back all the money that you invest. The investments referred to in this article may not be suitable for all investors, and if in doubt, an investor should seek advice from a qualified investment adviser.
Full performance can be found on the company or index summary page on the interactive investor website. Simply click on the company's or index name highlighted in the article.