How likely is that recession now? Here are the latest odds
26th January 2023 12:21
by Reda Farran from Finimize
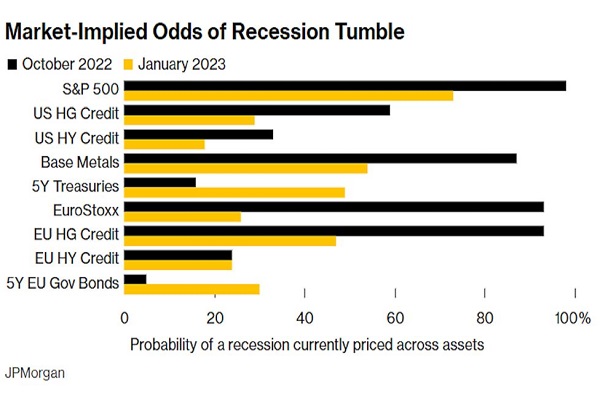
If you’re wondering how convinced the market might be about the likelihood that we’ll see a recession soon, this chart can help shed a little light.

If you’re wondering how convinced the market might be about the likelihood that we’ll see a recession soon, this chart can help shed a little light. It includes the market-implied odds of just such an event, across nine key assets, derived from a trading model created and updated by JPMorgan. And as you can see, the graph shows that the odds of an economic downturn priced into financial markets have fallen sharply from their 2022 highs in seven of the nine.
Take, for example, European stocks: in October, they were assigning a 93% probability that a recession would hit the region. Those odds have tumbled to just 26% today. It’s a big move, but it’s not overly shocking when you consider that economists at Goldman Sachs said earlier this month that they no longer see a recession hitting Europe. And it comes after a series of encouraging signs: the bloc’s economy proved more resilient at the end of 2022, natural gas prices fell sharply, and China (an important trading partner) abandoned its Covid restrictions earlier than anticipated.
In addition to showing that market-implied odds of a downturn are tumbling, the graph can be used to see which assets might offer the best risk-reward potential to implement your specific recession views. For example, even after coming down a lot from October, you can see that the S&P 500 is still pricing in a 73% chance of a US recession – the highest of all nine. That tells you that US stock prices are quite depressed in anticipation of an economic downturn. But it means they have a lot of upside potential if your base case is that the US will dodge a recession.
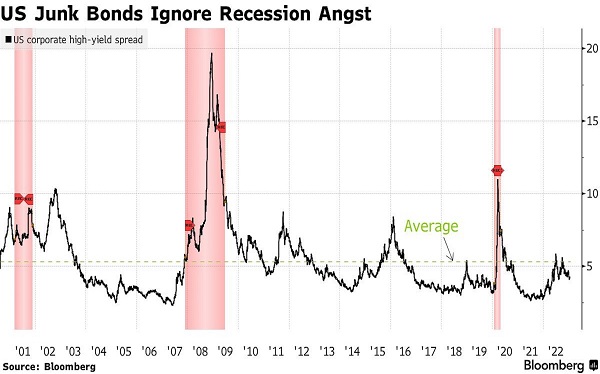
In contrast, US junk bonds (or as their proponents like to call them, “high yield” bonds) are pricing in just an 18% chance of a US recession – the lowest of the bunch. You can see why in the chart below, which shows that the yield spread between junk bonds and their Treasury equivalents is narrower than the average of the past two decades. Put differently, the additional yield that junk bonds are offering above safe government bonds to compensate for their extra risk is below their 20-year average. That means they’re not adequately pricing in the chance of a recession – and they may have a lot of downside potential if your base case is that the US economy will indeed enter a downturn.

US junk bond spreads are currently lower than their 20-year average and are well below the levels hit during previous recessions (shaded red areas). Source: Bloomberg.
Reda Farran is a senior analyst at finimize.
ii and finimize are both part of abrdn.
finimize is a newsletter, app and community providing investing insights for individual investors.
abrdn is a global investment company that helps customers plan, save and invest for their future.
These articles are provided for information purposes only. Occasionally, an opinion about whether to buy or sell a specific investment may be provided by third parties. The content is not intended to be a personal recommendation to buy or sell any financial instrument or product, or to adopt any investment strategy as it is not provided based on an assessment of your investing knowledge and experience, your financial situation or your investment objectives. The value of your investments, and the income derived from them, may go down as well as up. You may not get back all the money that you invest. The investments referred to in this article may not be suitable for all investors, and if in doubt, an investor should seek advice from a qualified investment adviser.
Full performance can be found on the company or index summary page on the interactive investor website. Simply click on the company's or index name highlighted in the article.