FTSE for Friday: a chart pattern and trading theory
Summer can be a tricky time for investors, vulnerable to bouts of volatility. Independent analyst Alistair Strang gives his take and forecasts for the FTSE 100 index.
19th July 2024 07:31
by Alistair Strang from Trends and Targets

Usually, we dread August as it’s generally clear the markets are really on holiday. Unfortunately, this has felt to be the case since the start of June this year but there’s been a couple of notable differences.
For instance, on Thursday, we advised clients the FTSE 100 expected gains but the US looked quite dodgy. This is quite unusual as the FTSE will generally exploit whatever has given the US a dose of collywobbles, ensuring a terrible session.
- Invest with ii: Open a Stocks & Shares ISA | ISA Investment Ideas | Transfer a Stocks & Shares ISA
Instead, as expected, the FTSE ended the day in positive territory while North American markets ended the session in the Red.
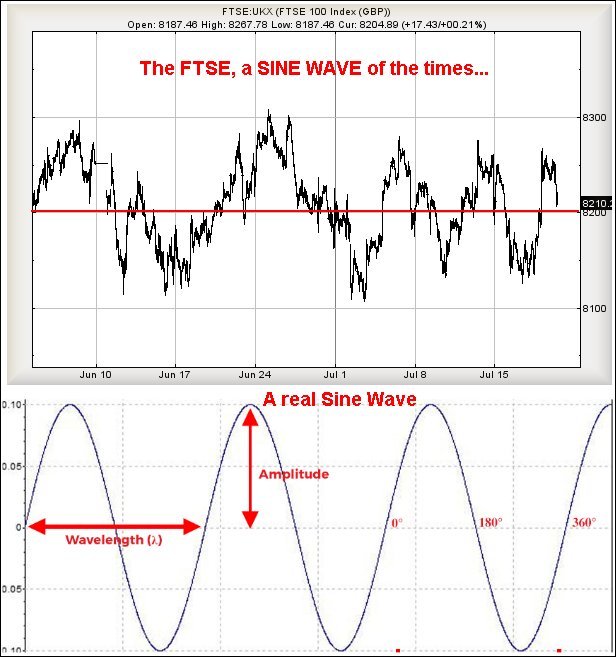
FTSE 100 market behaviour since the start of June has been truly awful. The chart below shows in minute-by-minute mode, how pathetic the market has been. We’d initially assumed this was something to do with the UK General Election but such a notion looks erroneous.
Are we to experience an even worse August or did everyone decide to take three months off this year?
We want to make fun of the movement pattern, calling it a Sine Wave, but a Sine Wave should be measurable in Wavelength, the distance between two peaks, and the FTSE clearly dodges such an accusation. However, it does come close in terms of Amplitude, the distance between the median and the highs. About the only conclusion which can be drawn is of time not mattering to the markets, only the variance above and below a roughly 8,200 points pivot level.
What’s the point of knowing this?
When it happens, a trader can enjoy a (usually brief) period when switching from short to long positions. Our rule of thumb is to allow for three peaks, then distrust everything. But in this instance, the FTSE has been playing ball through an amazing five peaks so far. And if our suspicion of August being pretty rubbish is right, this state of affairs could easily continue, after a doubtless short period when the market will throw all the toys out before reverting to placid behaviour again.

Source: Trends and Targets. Past performance is not a guide to future performance.
FTSE for Friday
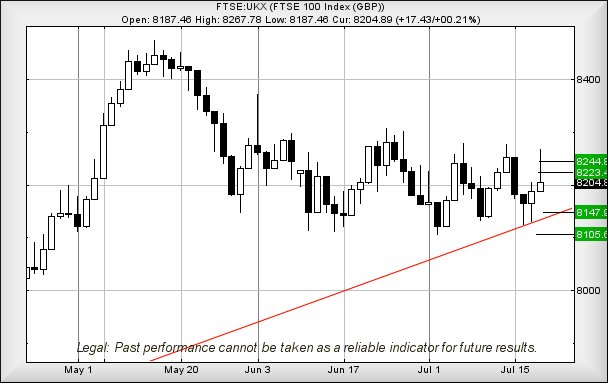
If we’re right with the voodoo science above, it will actually make a fair bit of sense if the FTSE 100 opens Friday at around 8,195 points, then experiences a surprising bounce to around 8,223 points. If bettered, our secondary works out at 8,244 points and a price level where the market could stutter a bit.
While visually this makes zero sense, it is certainly a theory and one which allows a super tight stop loss at 8,187 points. Our reasoning behind this outlandish idea is due to the market having a history since June of reverting to the median level of 8,200, then bouncing before a proper reversal.
Of course, we’ve a converse scenario we can present and it kicks into life if the FTSE manages below 8,187 points, it risks triggering reversal to an initial 8,147 with our secondary, if broken, at 8,105 points.

Source: Trends and Targets. Past performance is not a guide to future performance.
Alistair Strang has led high-profile and "top secret" software projects since the late 1970s and won the original John Logie Baird Award for inventors and innovators. After the financial crash, he wanted to know "how it worked" with a view to mimicking existing trading formulas and predicting what was coming next. His results speak for themselves as he continually refines the methodology.
Alistair Strang is a freelance contributor and not a direct employee of Interactive Investor. All correspondence is with Alistair Strang, who for these purposes is deemed a third-party supplier. Buying, selling and investing in shares is not without risk. Market and company movement will affect your performance and you may get back less than you invest. Neither Alistair Strang or Interactive Investor will be responsible for any losses that may be incurred as a result of following a trading idea.
These articles are provided for information purposes only. Occasionally, an opinion about whether to buy or sell a specific investment may be provided by third parties. The content is not intended to be a personal recommendation to buy or sell any financial instrument or product, or to adopt any investment strategy as it is not provided based on an assessment of your investing knowledge and experience, your financial situation or your investment objectives. The value of your investments, and the income derived from them, may go down as well as up. You may not get back all the money that you invest. The investments referred to in this article may not be suitable for all investors, and if in doubt, an investor should seek advice from a qualified investment adviser.
Full performance can be found on the company or index summary page on the interactive investor website. Simply click on the company's or index name highlighted in the article.