FTSE for Friday and Wall Street analysis too
7th January 2022 07:38
by Alistair Strang from Trends and Targets
With stocks off to a volatile start in 2022, independent analyst Alistair Strang studies potential movements in both London and on Wall Street.

It’s quite curious how both the FTSE 100, along with Wall Street, each managed to attain pretty important target levels at the start of 2022. These levels had been calculated as viable since the lows of March 2020 and we were inclined to anticipate some hesitation across the markets, if they made an appearance.
What really surprises us is the coincidence of each market reaching similar milestones at the same time, despite the trading patterns on the FTSE and Wall Street being utterly different. If there were any true similarity between the two, the FTSE would currently be trading around 9,600 points, rather than the 7,450 level!
Alternately, if Wall Street were exhibiting similar lack of strength to the FTSE, that particular index would presently be trading around 28,000 points rather than 36,000. Yet, for some mysterious reason, both markets reached a level we regard (from a Big Picture perspective) as pretty important, perhaps explaining the currently case of volatility.
- Why reading charts can help you become a better investor
- Friends & Family: ii customers can give up to 5 people a free subscription to ii, for just £5 a month extra. Learn more
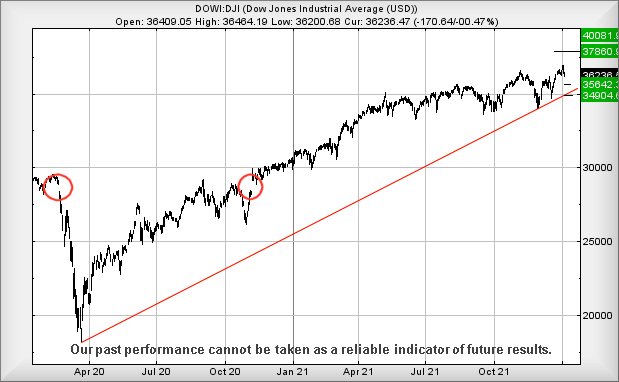
For the Dow Jones index, the immediate situation sounds serious, as weakness next below 36,200 calculates with a reversal potential toward 36,542 points. We’ve a pretty strong argument hoping for a bounce at such a level, ideally just above this target.
If 36,542 breaks, we can work out a “bottom” potential down at 34,900 points or so. It’s amazing to note such a “bottom” also virtually coincides with the Red uptrend since March 2020, again providing an argument for some sort of bounce.

Source: Trends and Targets. Past performance is not a guide to future performance
However, despite these slightly gloomy potentials, it’s worth remembering until such time Red breaks on the Dow Jones chart, the market has marginally exceeded our Big Picture target level and this tends imply the index is in an uptrend.
If this is indeed the case, anything next above 36,955 shall be regarded with impressive potentials, allowing growth to an initial 37,880 with secondary, if bettered, now at 40,080 points sometime in the future. We do expect a degree of hysterics and volatility, if the 40,000 level makes an appearance.
FTSE 100
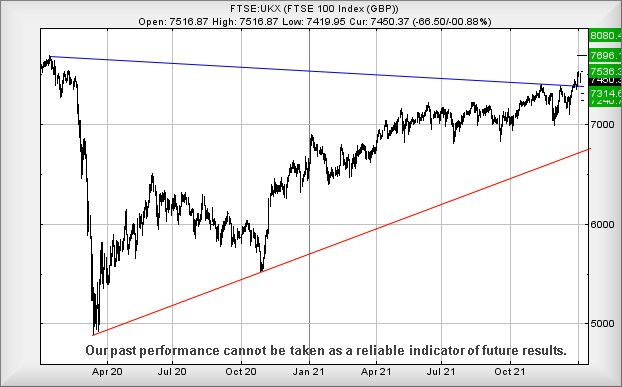
As for the FTSE, the recent visit to 7,530 was fascinating, taking the index into an important region where the Big Picture demanded the index close a session above 7,518 points to promise a future of wine and roses.
Alas, on the day, the best the FTSE could offer was closing at 7,516 points on Wednesday with Thursday providing a logical slight reversal. We take considerable hope from Wednesdays high of 7,530. Movement now above such a level (or closure above 7,518 points) now confirms a Big Picture potential of future movement to 7,696 points. If exceeded, our longer term secondary comes in at 8,080 points.
- Best 39 growth stocks for 2022
- Is this the year FTSE 100 finally hits 8,000?
- Watch our new year share tips here and subscribe to the ii YouTube channel for free
Even from an immediate stance, above just 7,496 points apparently should attempt near-term growth to 7,536 points. Obviously, such a target again exceeds Wednesday's high, also giving London a fair chance to close a session above 7,518 and triggering the foregoing Big Picture expectations.

Source: Trends and Targets. Past performance is not a guide to future performance
It’s almost difficult to pour misery on the FTSE’s future chances but, of course, we’ll take a stab at it. Currently, below 7,395 looks like it shall prove capable of triggering some reversals down to 7,314 points. Should the market opt to break such a level, our secondary works out at 7,240 points and a hopeful bounce.
Finally, we didn’t anticipate starting the year with such a statement, but we suspect this particular analysis shall prove worth printing out and sticking on the wall. From our perspective, quite a few of the foregoing numbers look pretty important for 2022.
Alistair Strang has led high-profile and "top secret" software projects since the late 1970s and won the original John Logie Baird Award for inventors and innovators. After the financial crash, he wanted to know "how it worked" with a view to mimicking existing trading formulas and predicting what was coming next. His results speak for themselves as he continually refines the methodology.
Alistair Strang is a freelance contributor and not a direct employee of Interactive Investor. All correspondence is with Alistair Strang, who for these purposes is deemed a third-party supplier. Buying, selling and investing in shares is not without risk. Market and company movement will affect your performance and you may get back less than you invest. Neither Alistair Strang or Interactive Investor will be responsible for any losses that may be incurred as a result of following a trading idea.
These articles are provided for information purposes only. Occasionally, an opinion about whether to buy or sell a specific investment may be provided by third parties. The content is not intended to be a personal recommendation to buy or sell any financial instrument or product, or to adopt any investment strategy as it is not provided based on an assessment of your investing knowledge and experience, your financial situation or your investment objectives. The value of your investments, and the income derived from them, may go down as well as up. You may not get back all the money that you invest. The investments referred to in this article may not be suitable for all investors, and if in doubt, an investor should seek advice from a qualified investment adviser.
Full performance can be found on the company or index summary page on the interactive investor website. Simply click on the company's or index name highlighted in the article.