FTSE for Friday and hopes for bitcoin
17th June 2022 07:40
by Alistair Strang from Trends and Targets
With stock markets in rapid retreat, investors are asking when will the selling end. Independent analyst Alistair Strang discusses some possible answers.

FTSE for Friday
For a while in 2021, we quite liked the way the FTSE 100 was behaving. Generally, the UK market was proving strong, while European markets were experiencing difficulty. Unfortunately, the UK has reverted to type, indulging in some truly awful dramatics just because everyone else is doing it.
It remains an ongoing puzzle just how governments intend to curb inflation by increasing interest rates, creating further pressure for prices to increase. Instead, why are Japan & China not being examined to discover the cause of their parsimonious inflation rates.
- Interest rates rise by 0.25%: how will it affect me?
- ii People’s Interest Rate Panel: our maiden vote on UK interest rates
- Inflation watch: cost of living up 9% at 40-year high
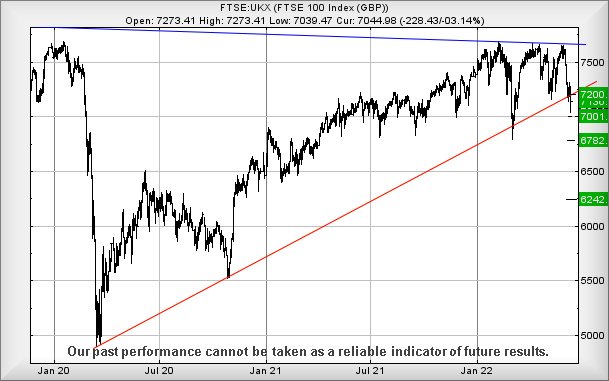
The FTSE is certainly in a problematic position, breaking the uptrend since the Covid-19 low and also failing to better the high of 2020, a point in time when ‘Pandemic’ was just a useful Scrabble word.
More frightening, market movements during June are starting to feel dangerously reminiscent of 2008, a point in time which was quite scary. If that’s the case, we’re only perhaps witnessing the opening salvoes of some troubled times.
The immediate situation suggests weakness now below 7,039 points threatens ongoing reversal to 7,001 points, a market level at which we’d hope for a bounce – in normal circumstances. Our secondary, should the initial target break, calculates at 6,782 points. We cannot suggest the secondary as a ‘longer term’ thing, thanks to current market movements proving painfully wide.
Our alternate scenario, if searching for gains, comes should the FTSE 100 manage to exceed 7,080 points, as apparently this risks triggering a surprise movement to 7,136 points.
Should this initial target be exceeded, our secondary calculates at 7,200 points. This secondary level should prove a really big deal, given it matches the point of trend break. Market closure above such a level shall indicate, quite firmly, the immediate drop cycle is probably over.

Past performance is not a guide to future performance.
Bitcoin battered and bruised
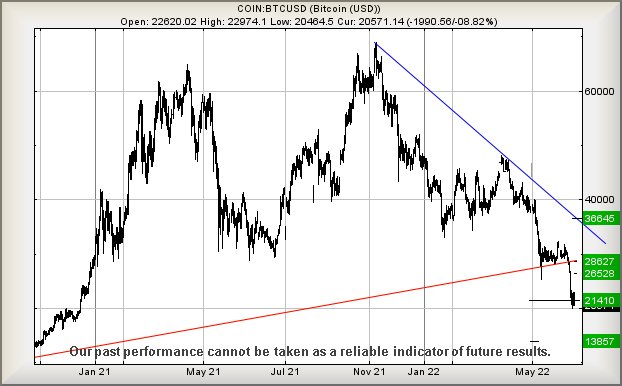
We reviewed bitcoin a month ago, speculating it was heading to $21,400. As hysteria in the media confirms, the crypto has indeed achieved this target level, ensuring the world has ended for some traders.
However, we’ve spotted something which may prove important in the spiral to oblivion!
Regular readers will know we habitually give a primary, then a secondary, target.
The reason for this is pretty straightforward, generally a price will not go directly to a target level. Instead, sometimes it will stutter around the primary target until sufficient number of suckers believe it’s not dropping further. Then it drops further.
However, we always throw in an important caveat, generally suggesting “our secondary, if initial target is broken, works out at XYZ”. There’s a little more to this statement than just giving ourselves some wiggle room as it’s often critical how a price behaves at a target level, if we’re going to be given a clue to future behaviour.
In the case of bitcoin, our argument was along the lines of “If $21,410 breaks, our longer term secondary calculates at $13,800.
When we zoom in and look at how bitcoin has behaved, there are a few interesting facets to the crypto's fall from grace which perhaps imply it’s not intending a return to price levels last seen toward the end of 2020.
With share prices, this sort of thing is a fairly big deal, so we’re obviously fascinated to see how the logic applies to crypto.

Past performance is not a guide to future performance.
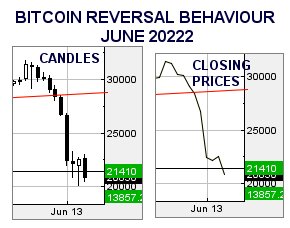
The chart extract above highlights something which may prove fascinating. The initial drop for bitcoin failed to break our 21,400 target, instead bouncing (slightly) around 21,900. The next day it indeed broke our target but closed above. Similarly on day three.
Without a doubt, our target level has validity but it took a fourth session before bitcoin finally immolated itself. When this sort of thing occurs with share prices, we tend toward considerable caution with expectations for our secondary to make an appearance.
Instead, we start looking for early logic which shall indicate surprise recovery. At time of writing, bitcoin is trading around 20,400, needing “only” to jump $2,000 above $22,400 to suggest it’s all been a bad dream and some recovery is happening!
Who knows, perhaps bitcoin shall again surprise everyone…

Past performance is not a guide to future performance.
Alistair Strang has led high-profile and "top secret" software projects since the late 1970s and won the original John Logie Baird Award for inventors and innovators. After the financial crash, he wanted to know "how it worked" with a view to mimicking existing trading formulas and predicting what was coming next. His results speak for themselves as he continually refines the methodology.
Alistair Strang is a freelance contributor and not a direct employee of Interactive Investor. All correspondence is with Alistair Strang, who for these purposes is deemed a third-party supplier. Buying, selling and investing in shares is not without risk. Market and company movement will affect your performance and you may get back less than you invest. Neither Alistair Strang or Interactive Investor will be responsible for any losses that may be incurred as a result of following a trading idea.
These articles are provided for information purposes only. Occasionally, an opinion about whether to buy or sell a specific investment may be provided by third parties. The content is not intended to be a personal recommendation to buy or sell any financial instrument or product, or to adopt any investment strategy as it is not provided based on an assessment of your investing knowledge and experience, your financial situation or your investment objectives. The value of your investments, and the income derived from them, may go down as well as up. You may not get back all the money that you invest. The investments referred to in this article may not be suitable for all investors, and if in doubt, an investor should seek advice from a qualified investment adviser.
Full performance can be found on the company or index summary page on the interactive investor website. Simply click on the company's or index name highlighted in the article.