eyeQ: a three-pronged approach to investing
Experts at eyeQ have used AI and their own smart machine to analyse macro conditions and generate actionable trading signals. This time they give their current view on a big brand name.
5th March 2025 10:31
by Huw Roberts from eyeQ

“Our signals are crafted through macro-valuation, trend analysis, and meticulous back-testing. This combination ensures a comprehensive evaluation of an asset's value, market conditions, and historical performance.” eyeQ
- Discover: eyeQ analysis explained | eyeQ: our smart machine in action | Glossary
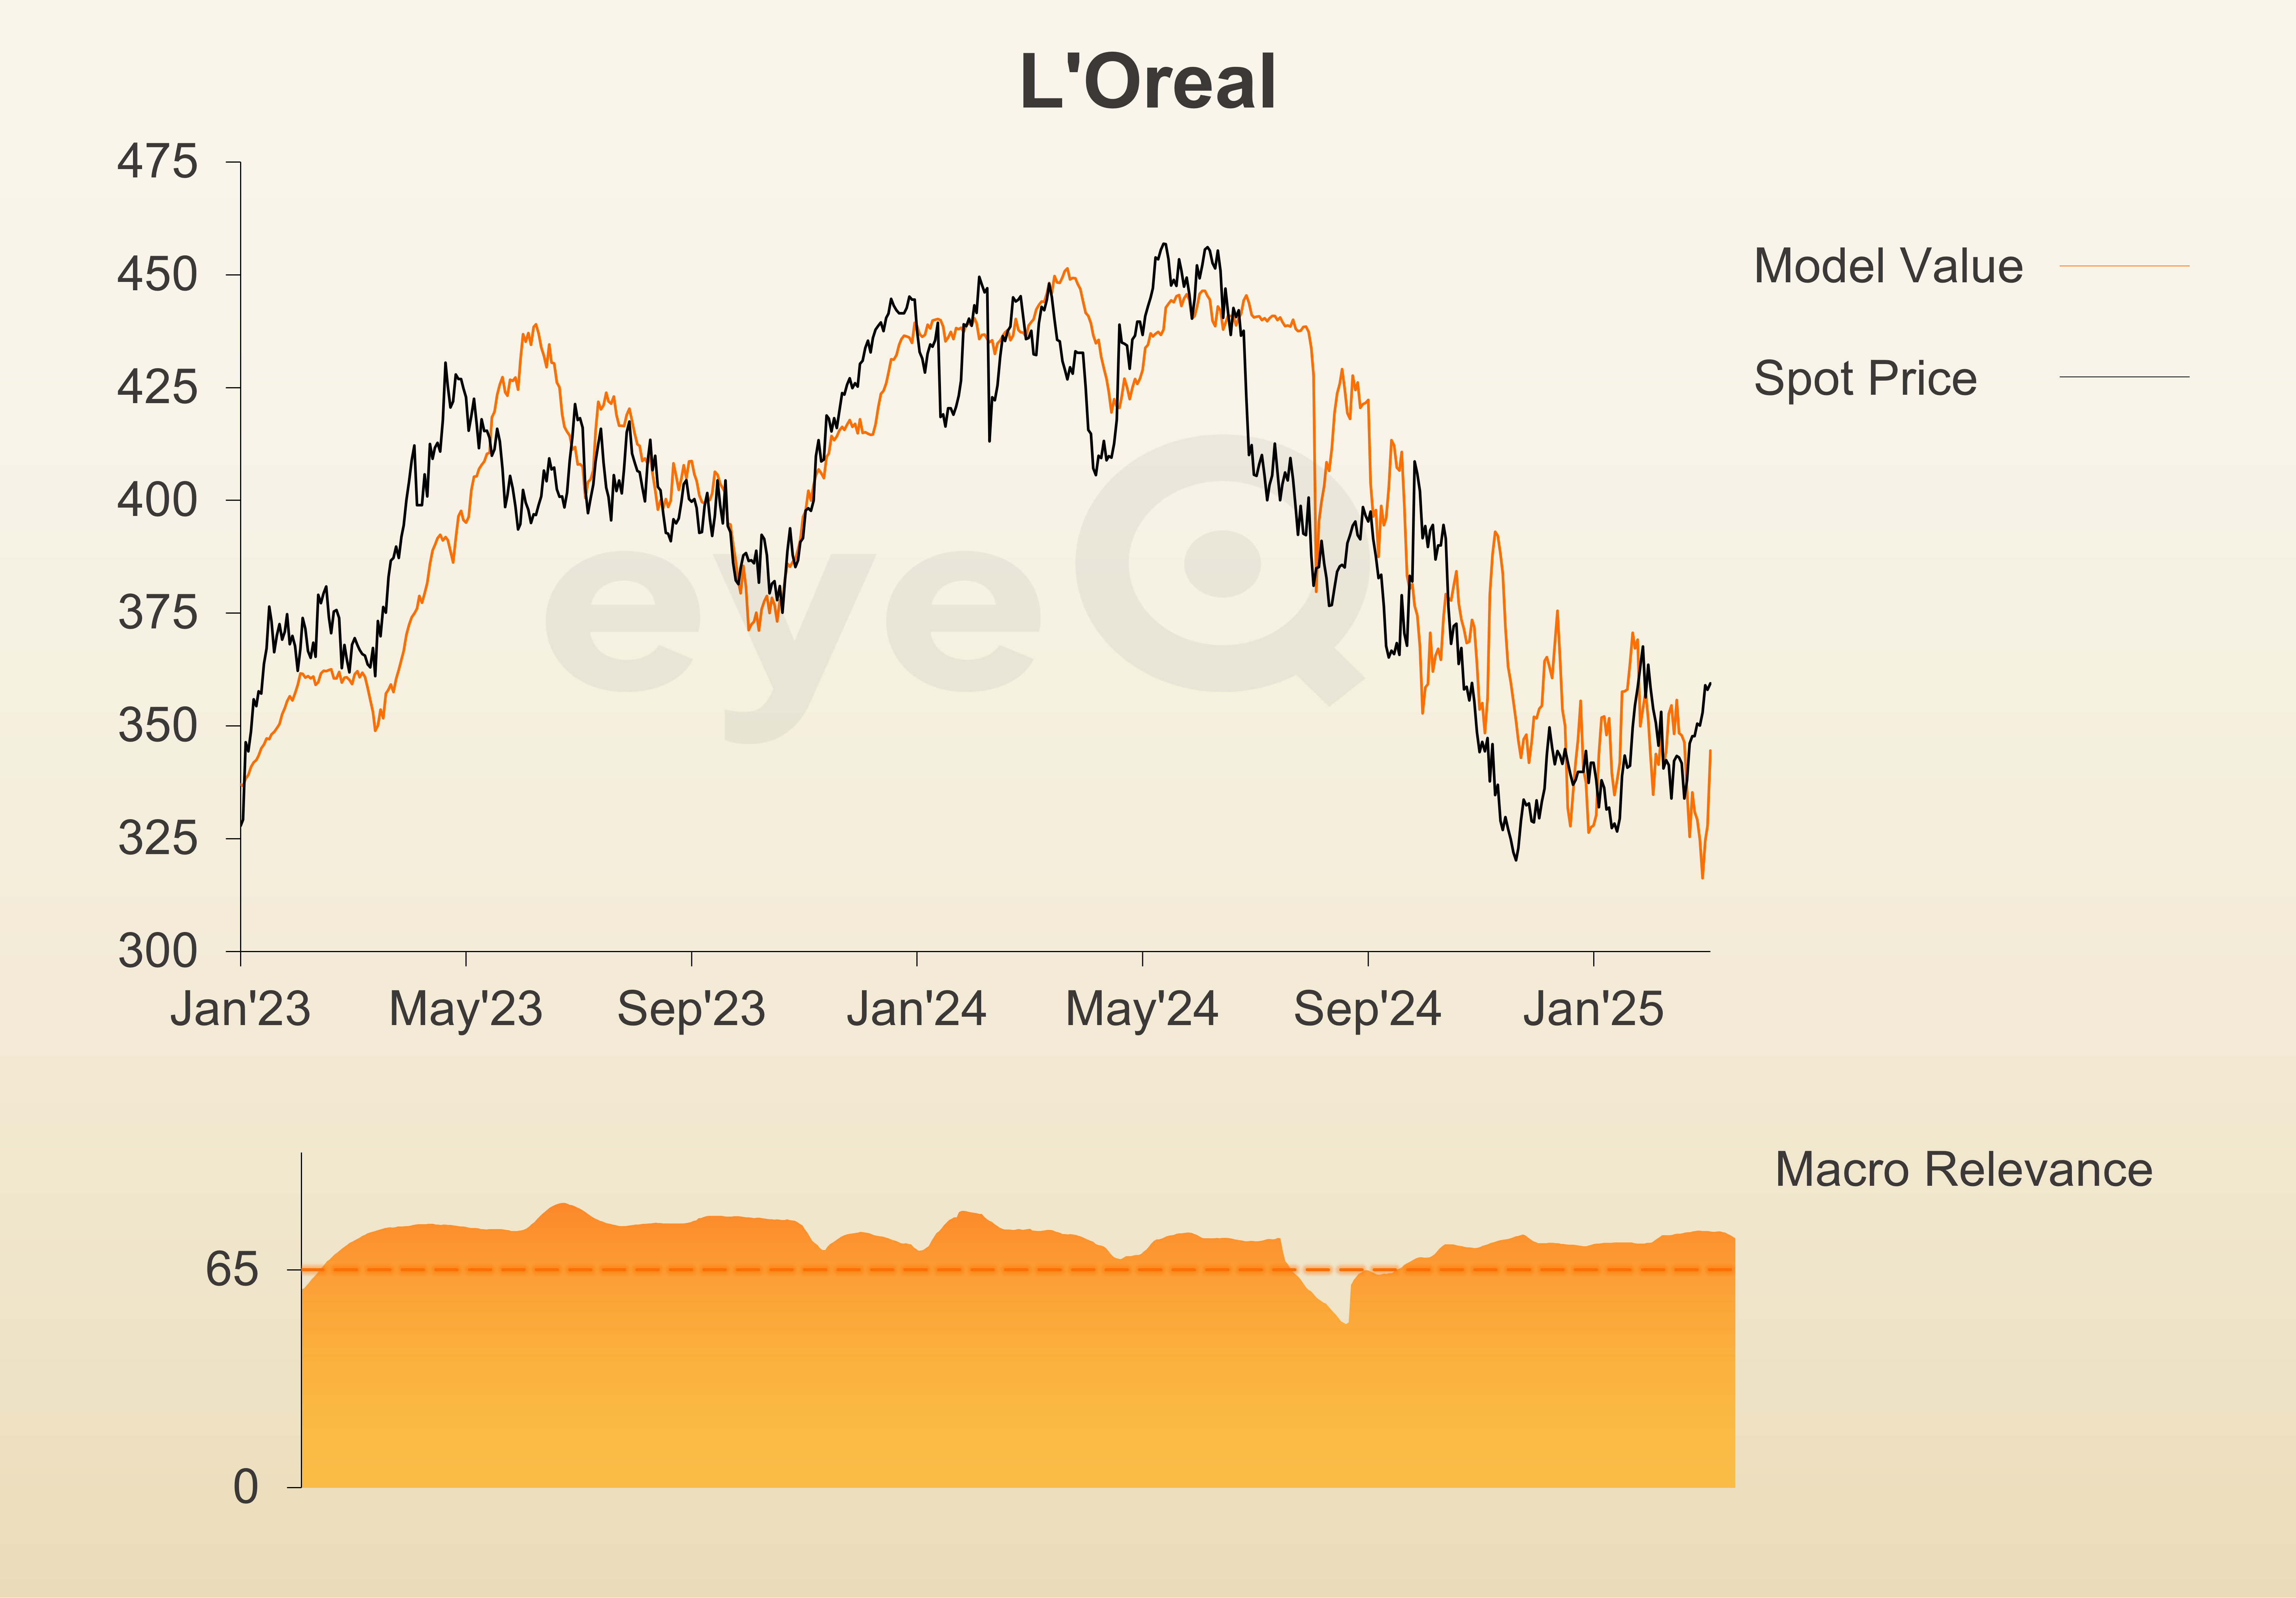
L’Oreal
Macro Relevance: 75%
Model Value: 346.46
Fair Value Gap: +3.99% premium to model value
Data correct as at 5 March 2025. Please click glossary for explanation of terms. Long-term strategic model.
Crudely there are three different ways to approach investing:
- Company fundamentals: bottom-up analysis of the individual company using metrics such as price/earnings (PE) and the like.
- Macro fundamentals: top-down analysis of the economy. Is the economy growing or contracting? Are the Federal Reserve, Bank of England or European Central Bank cutting interest rates or hiking?
- Technical analysis: do the charts suggest the stock is an uptrend, downtrend or choppy range?
Ideally you want to incorporate all three elements into your investment process.
Indeed, the gold-plated signal comes when a stock is cheap from both a micro and macro perspective, and the charts suggest we’re at key support or embarking on a strong uptrend. When you see that, fill your boots!
Sadly, more often than not, markets are messier and these three approaches aren’t always aligned.
Analyst and ii contributor Rodney Hobson is constructive on L'Oreal SA (EURONEXT:OR) from the bottom-up point of view.
The macro view is slightly more cautious. eyeQ model value is around €346 - that’s where the stock “should be” given prevailing macro conditions.
The recent rally has run ahead of this, so L’Oreal screens as almost 4% rich on our metrics. That’s a modest valuation gap. Nowhere near enough to get bearish, but not the best entry level from a macro perspective either.
Two other considerations.
Macro relevance is high (75%), so the big-picture stuff is important right now. But you can see how noisy eyeQ model value has become over the past five months.
This is the Trump effect. Macro has become noisy - tariffs, trade wars, Department of Government Efficiency (DOGE) job cuts, deregulation, deportations, tax cuts, European rearmament, Gaza. The headlines are coming thick and fast, and this is making for a choppy, volatile environment.
In the three months since Trump won the election, eyeQ model value for L’Oreal has been chopping around in a €315-375 range. For macro to fire a bullish signal, we’d want to see model value break above that range.
Finally, what could do that? The biggest driver of our model right now is the euro - L’Oreal wants a stronger euro. Sometimes companies which export want a weak currency to make their goods more attractive. But sometimes foreign exchange markets act as a barometer of economic confidence: a strong currency speaks to a strong economy.
There are signs that pattern is unfolding now.
The euro is starting to rally. Even with the prospects of tariffs, the foreign exchange market is focusing on European rearmament. Yes, first and foremost that benefits the Rheinmetall AG (XETRA:RHM)s, Saab AB Class B (OMX:SAAB B)s and BAE Systems (LSE:BA.)of this world. But there are signs markets see this as a boost to European economic growth more broadly. And, on current patterns, that’s good news for L’Oreal.
Source: eyeQ. Past performance is not a guide to future performance.
Useful terminology:
Model value
Where our smart machine calculates that any stock market index, single stock or exchange-traded fund (ETF) should be priced (the fair value) given the overall macroeconomic environment.
Model (macro) relevance
How confident we are in the model value. The higher the number the better! Above 65% means the macro environment is critical, so any valuation signals carry strong weight. Below 65%, we deem that something other than macro is driving the price.
Fair Value Gap (FVG)
The difference between our model value (fair value) and where the price currently is. A positive Fair Value Gap means the security is above the model value, which we refer to as “rich”. A negative FVG means that it's cheap. The bigger the FVG, the bigger the dislocation and therefore a better entry level for trades.
Long Term model
This model looks at share prices over the last 12 months, captures the company’s relationship with growth, inflation, currency shifts, central bank policy etc and calculates our key results - model value, model relevance, Fair Value Gap.
These third-party research articles are provided by eyeQ (Quant Insight). interactive investor does not make any representation as to the completeness, accuracy or timeliness of the information provided, nor do we accept any liability for any losses, costs, liabilities or expenses that may arise directly or indirectly from your use of, or reliance on, the information (except where we have acted negligently, fraudulently or in wilful default in relation to the production or distribution of the information).
The value of your investments may go down as well as up. You may not get back all the money that you invest.
Equity research is provided for information purposes only. Neither eyeQ (Quant Insight) nor interactive investor have considered your personal circumstances, and the information provided should not be considered a personal recommendation. If you are in any doubt as to the action you should take, please consult an authorised financial adviser.
Disclosure
We use a combination of fundamental and technical analysis in forming our view as to the valuation and prospects of an investment. Where relevant we have set out those particular matters we think are important in the above article, but further detail can be found here.
Please note that our article on this investment should not be considered to be a regular publication.
Details of all recommendations issued by ii during the previous 12-month period can be found here.
ii adheres to a strict code of conduct. Contributors may hold shares or have other interests in companies included in these portfolios, which could create a conflict of interests. Contributors intending to write about any financial instruments in which they have an interest are required to disclose such interest to ii and in the article itself. ii will at all times consider whether such interest impairs the objectivity of the recommendation.
In addition, individuals involved in the production of investment articles are subject to a personal account dealing restriction, which prevents them from placing a transaction in the specified instrument(s) for a period before and for five working days after such publication. This is to avoid personal interests conflicting with the interests of the recipients of those investment articles.