eyeQ: should I buy the FTSE 100 or FTSE 250?
Experts at eyeQ have used AI and their own smart machine to analyse macro conditions and generate actionable trading signals. Here’s the index it rates highest right now.
17th July 2024 11:14
by Huw Roberts from eyeQ

"Our signals are crafted through macro-valuation, trend analysis, and meticulous back-testing. This combination ensures a comprehensive evaluation of an asset's value, market conditions, and historical performance." eyeQ
- Discover: eyeQ analysis explained | eyeQ: our smart machine in action | Glossary
iShares Core FTSE 100 ETF
Trading signal: long-term strategic model
Model value: 817.02
Fair Value Gap: -3.11% discount to model value
Model relevance: 81%
Data correct as at 17 July 2024. Please click glossary for explanation of terms.
iShares FTSE 250 ETF
Trading signal: long-term strategic model
Model value: 1,970.32
Fair Value Gap: +0.16% premium to model value
Model relevance: 93%
Data correct as at 17 July 2024. Please click glossary for explanation of terms.
Just after the election results our weekly video for ii focused on the investment implications of a new Labour government.
One of the messages from eyeQ: time for unloved UK stocks to shine again was that the FTSE 250 index might offer a better opportunity. If the incoming administration is able to provide a successful boost to the UK’s growth prospects, then the better option might be to focus on the FTSE 250, which includes companies geared to domestic UK growth, rather than the FTSE 100, which is full of names with big international exposure.
The video looked at the “relative value” between two tracking exchange-traded funds (ETFs) – iShares Core FTSE 100 ETF GBP Dist (LSE:ISF), which tracks the FTSE 100, and iShares FTSE 250 ETF GBP Dist (LSE:MIDD), which provides exposure to the FTSE 250.
We flag now, first because the trade has worked very quickly. In round numbers since the 4 July election date, the MIDD ETF has rallied 1%, while ISF is down 1%.
And, second, that spate of MIDD outperformance has taken it to rich levels versus macro conditions, and our smart machine has fired a signal suggesting the move has gone too far. The FTSE 250 ETF is now 3.02% rich versus the FTSE 100 tracker.
In the data above, we show the relevant statistics for the two ETFs outright instead of the relative value model. But the story is the same. The initial euphoria after Labour’s win is, on our metrics, starting to look a little extended. At least for this particular trade.
Right now, if you believe UK equities can continue to perform, there’s more mileage in the FTSE 100 and using the iShares Core FTSE 100 ETF.
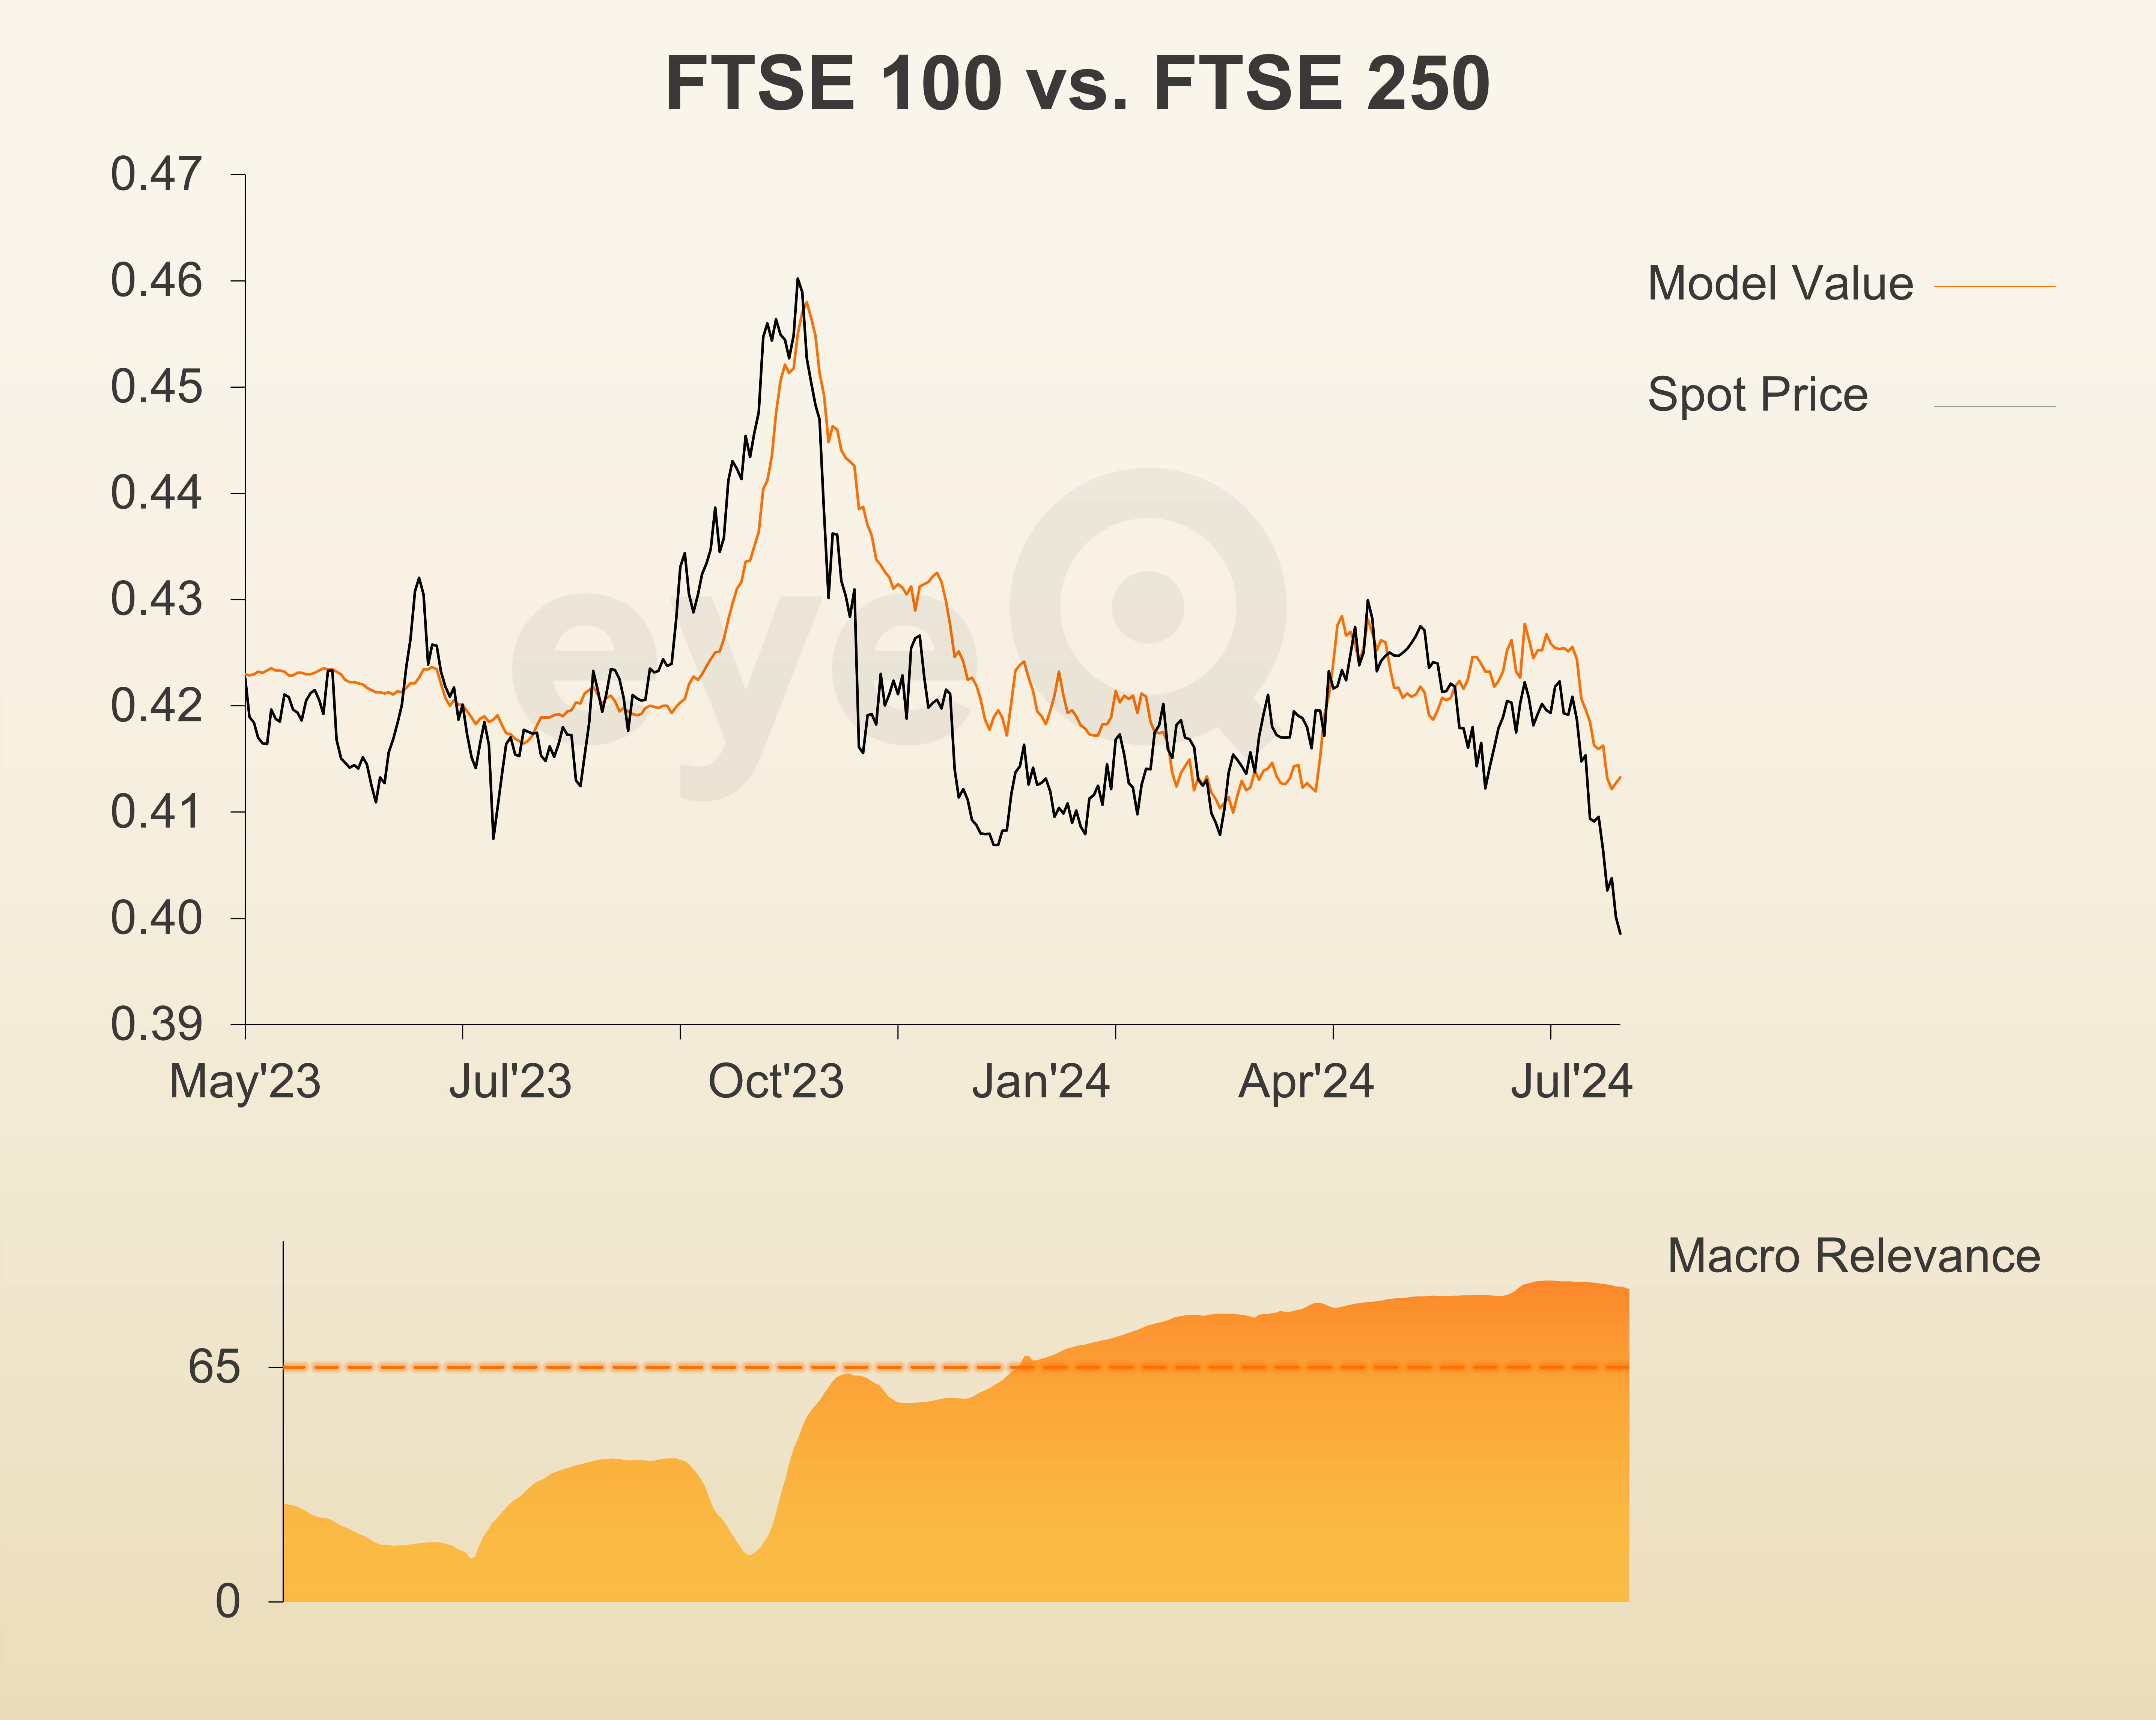
Source: eyeQ. Past performance is not a guide to future performance. Notes: Chart shows the ratio between the two ETFs.
Useful terminology:
Model value
Where our smart machine calculates that any stock market index, single stock or exchange-traded fund (ETF) should be priced (the fair value) given the overall macroeconomic environment.
Model (macro) relevance
How confident we are in the model value. The higher the number the better! Above 65% means the macro environment is critical, so any valuation signals carry strong weight. Below 65%, we deem that something other than macro is driving the price.
Fair Value Gap (FVG)
The difference between our model value (fair value) and where the price currently is. A positive Fair Value Gap means the security is above the model value, which we refer to as “rich”. A negative FVG means that it's cheap. The bigger the FVG, the bigger the dislocation and therefore a better entry level for trades.
Long Term model
This model looks at share prices over the last 12 months, captures the company’s relationship with growth, inflation, currency shifts, central bank policy etc and calculates our key results - model value, model relevance, Fair Value Gap.
These third-party research articles are provided by eyeQ (Quant Insight). interactive investor does not make any representation as to the completeness, accuracy or timeliness of the information provided, nor do we accept any liability for any losses, costs, liabilities or expenses that may arise directly or indirectly from your use of, or reliance on, the information (except where we have acted negligently, fraudulently or in wilful default in relation to the production or distribution of the information).
The value of your investments may go down as well as up. You may not get back all the money that you invest.
Equity research is provided for information purposes only. Neither eyeQ (Quant Insight) nor interactive investor have considered your personal circumstances, and the information provided should not be considered a personal recommendation. If you are in any doubt as to the action you should take, please consult an authorised financial adviser.
Disclosure
We use a combination of fundamental and technical analysis in forming our view as to the valuation and prospects of an investment. Where relevant we have set out those particular matters we think are important in the above article, but further detail can be found here.
Please note that our article on this investment should not be considered to be a regular publication.
Details of all recommendations issued by ii during the previous 12-month period can be found here.
ii adheres to a strict code of conduct. Contributors may hold shares or have other interests in companies included in these portfolios, which could create a conflict of interests. Contributors intending to write about any financial instruments in which they have an interest are required to disclose such interest to ii and in the article itself. ii will at all times consider whether such interest impairs the objectivity of the recommendation.
In addition, individuals involved in the production of investment articles are subject to a personal account dealing restriction, which prevents them from placing a transaction in the specified instrument(s) for a period before and for five working days after such publication. This is to avoid personal interests conflicting with the interests of the recipients of those investment articles.