eyeQ: HSBC - time to buy banking colossus?
Experts at eyeQ have used AI and their own smart machine to analyse macro conditions and generate actionable trading signals. Here’s what it says about the FTSE 100 lender ahead of results tomorrow.
18th February 2025 10:41
by Huw Roberts from eyeQ

"Our signals are crafted through macro-valuation, trend analysis, and meticulous back-testing. This combination ensures a comprehensive evaluation of an asset's value, market conditions, and historical performance." eyeQ
- Discover: eyeQ analysis explained | eyeQ: our smart machine in action | Glossary
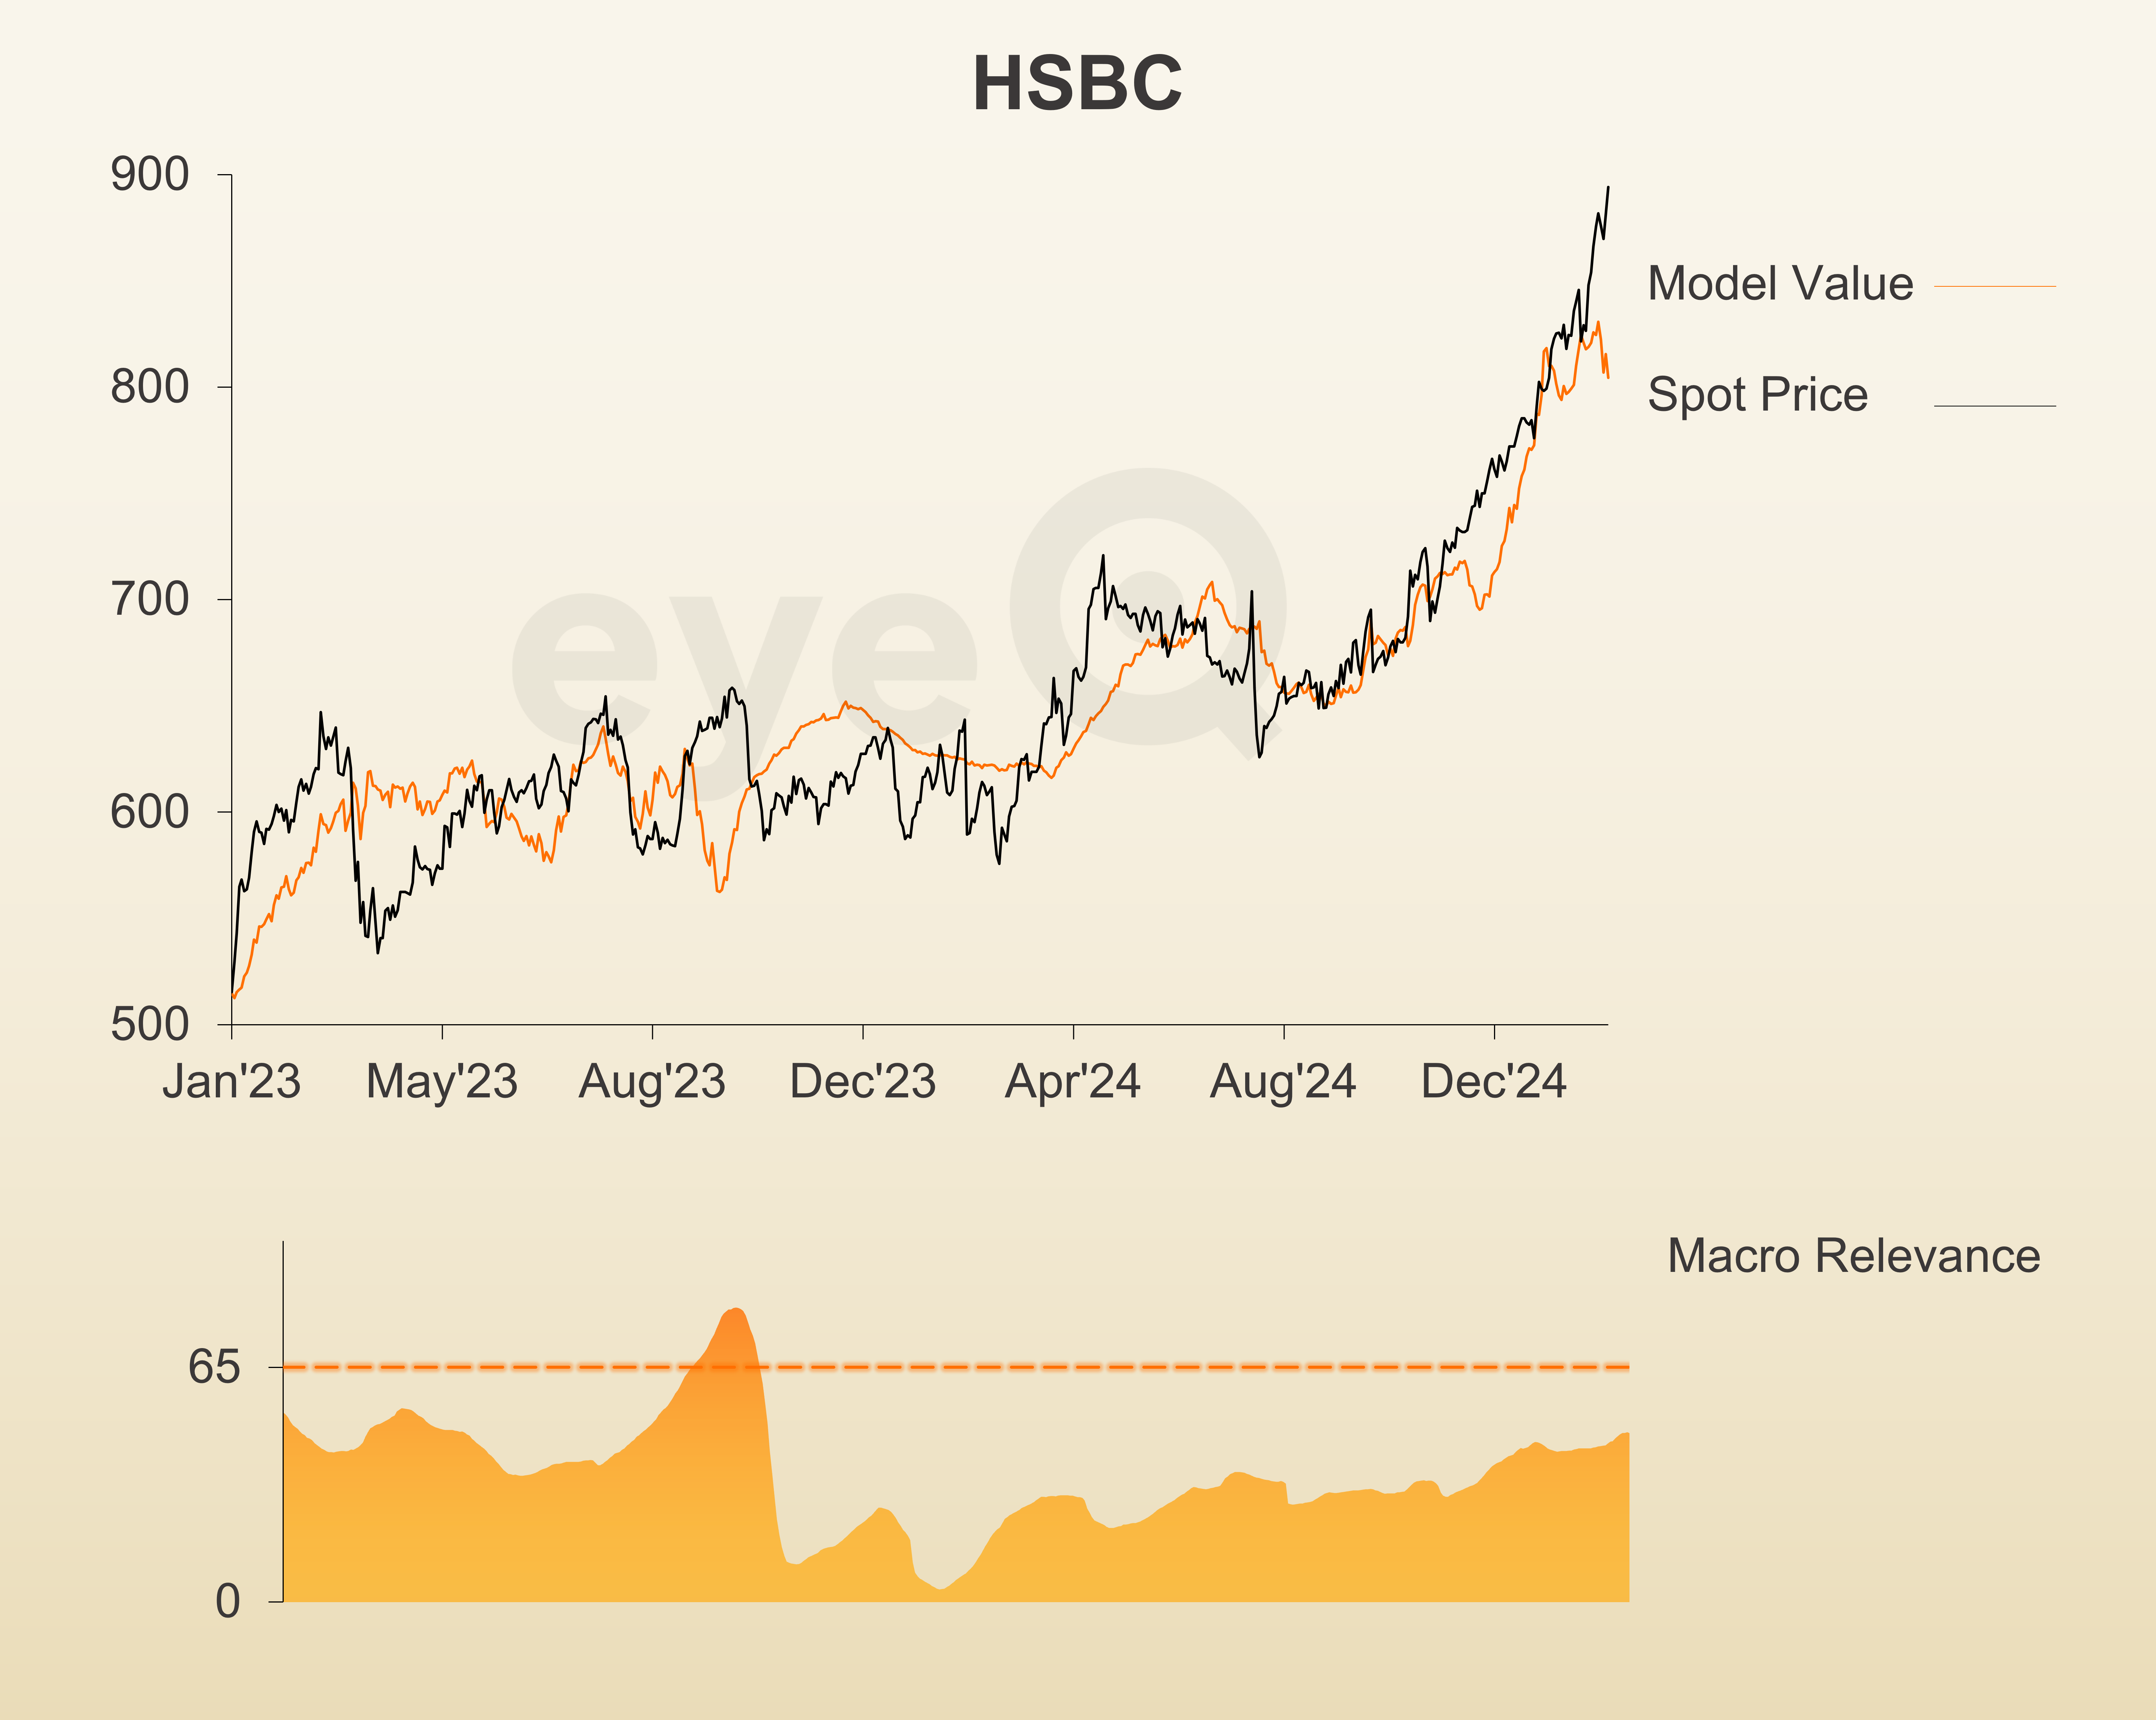
HSBC
Macro Relevance: 47%
Model Value: 84.05p
Fair Value Gap: +10.05% premium to model value
Data correct as at 18 February 2025. Please click glossary for explanation of terms. Long-term strategic model.
HSBC Holdings (LSE:HSBA) reports earnings tomorrow and the mood is optimistic. Last week, the market liked Barclays (LSE:BARC) and NatWest Group (LSE:NWG)’s results. UK banks have had a decent run of late and HSBC is up 34% since 1 October.
In HSBC’s case the hope is that cost-cutting and a shift in the bank’s strategy will start to bear fruit. So far, so good. But what’s the macro perspective?
The stock looks rich on eyeQ’s models, it is 10.05% above macro-warranted model value of 804.36p. That’s the richest fair value gap since May last year.
There are two health warnings. Macro Relevance of 47% means big-picture stuff such as inflation and the Bank of England’s policy stance explain less than half of price action. That makes tomorrow’s earnings more important.
Second, model value had been rising consistently for six months. But that improvement in macro conditions is showing signs of stalling. It’s yet to make a new low and we need to see model value below late January’s recent low at 794p to suggest a top has been formed and momentum is shifting lower.
To get an official bearish signal, we’d need to see two developments; macro relevance rising above our 65% threshold for a macro regime, and model value making new local lows.
So, no definitive action from us at least not right here, right now. But the bottom line is that these don’t look great levels to be chasing the upside from a purely macro perspective.
Source: eyeQ. Past performance is not a guide to future performance.
Useful terminology:
Model value
Where our smart machine calculates that any stock market index, single stock or exchange-traded fund (ETF) should be priced (the fair value) given the overall macroeconomic environment.
Model (macro) relevance
How confident we are in the model value. The higher the number the better! Above 65% means the macro environment is critical, so any valuation signals carry strong weight. Below 65%, we deem that something other than macro is driving the price.
Fair Value Gap (FVG)
The difference between our model value (fair value) and where the price currently is. A positive Fair Value Gap means the security is above the model value, which we refer to as “rich”. A negative FVG means that it's cheap. The bigger the FVG, the bigger the dislocation and therefore a better entry level for trades.
Long Term model
This model looks at share prices over the last 12 months, captures the company’s relationship with growth, inflation, currency shifts, central bank policy etc and calculates our key results - model value, model relevance, Fair Value Gap.
These third-party research articles are provided by eyeQ (Quant Insight). interactive investor does not make any representation as to the completeness, accuracy or timeliness of the information provided, nor do we accept any liability for any losses, costs, liabilities or expenses that may arise directly or indirectly from your use of, or reliance on, the information (except where we have acted negligently, fraudulently or in wilful default in relation to the production or distribution of the information).
The value of your investments may go down as well as up. You may not get back all the money that you invest.
Equity research is provided for information purposes only. Neither eyeQ (Quant Insight) nor interactive investor have considered your personal circumstances, and the information provided should not be considered a personal recommendation. If you are in any doubt as to the action you should take, please consult an authorised financial adviser.
Disclosure
We use a combination of fundamental and technical analysis in forming our view as to the valuation and prospects of an investment. Where relevant we have set out those particular matters we think are important in the above article, but further detail can be found here.
Please note that our article on this investment should not be considered to be a regular publication.
Details of all recommendations issued by ii during the previous 12-month period can be found here.
ii adheres to a strict code of conduct. Contributors may hold shares or have other interests in companies included in these portfolios, which could create a conflict of interests. Contributors intending to write about any financial instruments in which they have an interest are required to disclose such interest to ii and in the article itself. ii will at all times consider whether such interest impairs the objectivity of the recommendation.
In addition, individuals involved in the production of investment articles are subject to a personal account dealing restriction, which prevents them from placing a transaction in the specified instrument(s) for a period before and for five working days after such publication. This is to avoid personal interests conflicting with the interests of the recipients of those investment articles.