An election-year playbook for investors
Here's what you should know about the usual voting-year stock market patterns, and how you might prepare your portfolio for the next US election.
4th October 2024 10:08
by Reda Farran from Finimize

Historically, stocks have tended to stumble slightly and market volatility has risen before a presidential election, and there’s been a post-vote relief rally that has lasted through the late January inauguration. But the party who wins the White House has generally made minimal difference on stock market returns in the long run.
- If former President Donald Trump returns to the White House, there could be a sharp increase in tariffs on imports to the US. To hedge against the risks that are likely to accompany those plans, you could consider investing in the US dollar. After all, a heavy round of tariffs would likely strengthen the greenback.
- If Vice-President Kamala Harris moves into the Oval Office, that will likely be good news for industries like wind and solar energy, EV manufacturers, charging network operators, and battery makers. Homebuilders could benefit as well, helped by Harris's goal of increasing housing availability in the US.
Some things are fairly predictable about a US presidential election year: you can expect a boost in the sales of red, white, and blue balloons, and a certain rise and fall in stocks. But each set of candidates brings a unique set of policy priorities and risks too. So with the big vote just over a month away, it’s worth taking a look at the usual market patterns and the election-year playbook you might want to consider now.
How do US stocks generally perform in an election year?
Historically, it’s common for stocks to stumble slightly and for market volatility to rise before an election, which is often followed by a post-election relief rally that lasts through the inauguration. As for that wobble, though, Cetera Financial Group analysed the 19 presidential election years since the Second World War, and found that the S&P 500 has had an average total return of -0.6% in the 60 days leading up to the big vote.
Returns in this period have tended to be better when the incumbent party has won the White House, with an average gain of 2.9%, compared to an average loss of 3.6% when the other side has won. That makes sense: markets hate uncertainty – political or otherwise. And those stronger returns leading into a vote won by the incumbent party suggest that markets have had a pretty good intuition about how the election would turn out. And in essence, that suggests that positive returns in this 60-day period before the election could be a good omen for Vice-President Kamala Harris, while weak returns might be a positive sign for former President Donald Trump. (Of course, that’s a simplistic rule, so you’ll want to take that with a big grain of salt).
Then, there’s the post-ballot period. From the early November election day to the late January inauguration day, the S&P 500 has averaged a 1.5% gain during the 19 presidential election years since 1944. Returns were only slightly better on average when the incumbent party wins. But what does seem to make a difference is how close the election is. Research Affiliates examined the returns before and after the 24 presidential elections that have taken place since 1928, and found that the post-vote rally was much stronger following a cliffhanger result compared to a landslide, with small-cap and value stocks faring particularly well.
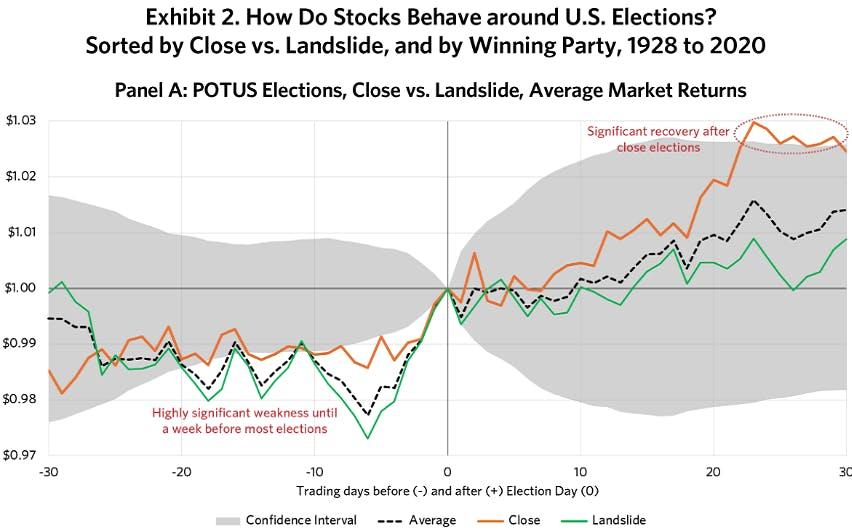
During US presidential elections, stock market rallies were much stronger following a cliffhanger result compared to a landslide. Source: Research Affiliates.
Finally, there’s the presidential term itself. And surprisingly, for all their differences, the party in office has made minimal difference on stock market returns in the long run. In other words, historical returns have been strong, regardless of whether it’s a Democrat or a Republican in the Oval Office. In the past 19 presidential terms, the S&P 500 has posted an average annualised return of 11.9%, with the first year of a presidency usually the strongest and the second year typically the weakest. Annualised returns were higher under Democrats (15%) than under Republicans (9.1%). But that’s mainly because returns during George W. Bush’s two terms were both negative (his presidency began in the midst of the dot-com bust downtrend and ended during the global financial crisis).
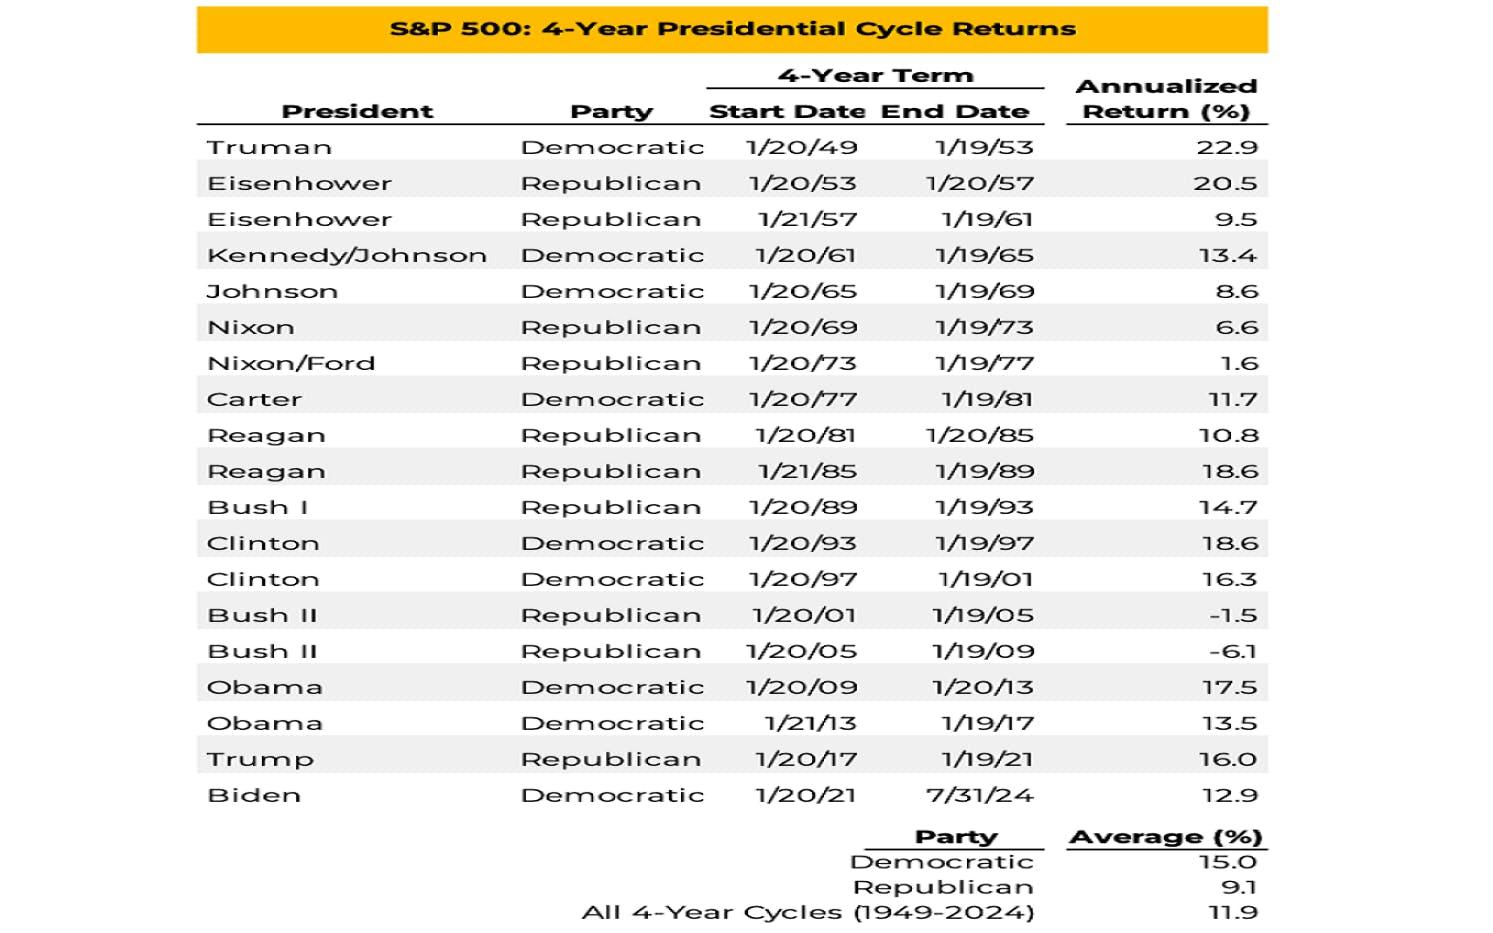
Returns of the S&P 500 over four-year presidential cycles. Source: Cetera Financial Group.
What are the big economic risks this time around?
If Harris wins the White House, that’s likely to result in a continuation of many of the policies of the current administration, where she’s second-in-command. So it’s probably worth assessing first and foremost what might be the biggest change if Trump returns to the White House. And of all the things the former president says he’ll shake up, global trade is arguably the biggest.
He’s proposed a 10% minimum tariff on all imports and a 60% tax on all goods coming from China. That’s huge: according to calculations from Barclays, the measures would amount to an import-weighted average tariff of 17% – a level not seen since 1935.
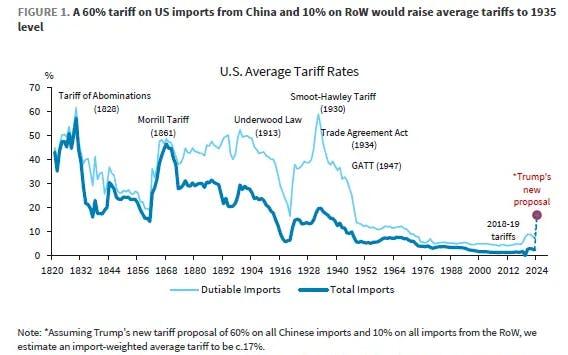
A 10% tariff on all imports to the US and a 60% tax on all goods coming from China would raise average tariffs to a level not seen since the Great Depression. Source: Barclays.
Needless to say, an average tariff of 17% would lead to higher costs for American consumers. Those rising costs, naturally, would drive up inflation, which would likely result in new economy-dragging interest rate hikes to combat it. Research group Capital Economics estimates that a 10% tariff would nudge annual inflation to as high as 4% – double the Federal Reserve’s (Fed’s) target – within a year.
The global backdrop is where things could get really ugly. If trade partners retaliate, levying tariffs of their own, it could upset worldwide trade and shrink economic output by 1.4% in the US, 2% in China, and 0.7% in the eurozone, according to Barclays.
Is there a way to protect your portfolio from this risk?
Unfortunately, it’s tricky to find a reliable hedge against the impact of higher tariffs. But one asset that could potentially work well is the US dollar. See, Trump’s tariff plan would have three big implications for the greenback, all of which would likely see it strengthen.
First, they would curb imports, resulting in fewer dollars “sold” to purchase foreign goods, which would bolster the currency over time. Second, they could push the Fed to slow its interest rate cuts or even increase borrowing costs to address rising inflation, resulting in "higher for longer" rates that would boost the dollar by making it more attractive to foreign investors and savers. Third, they could set off a sprawling, damaging trade war, ramping up safe-haven demand for the greenback.
With all that potentially happening, you might have a look at a US dollar fund. They can provide an effective way of betting on the greenback to strengthen against a basket of foreign currencies.
OK, and what about if Harris wins the election?
With the Democrats’ positive stance on renewables and EVs, a Harris win would be good news for industries like wind and solar energy, EV manufacturers, charging network operators, and battery makers.
Homebuilders could benefit as well. Harris has called for the construction of three million new housing units, proposed up to $25,000 in down-payment assistance for first-time buyers, and suggested a tax incentive for builders who focus on starter homes – affordable, smaller-sized places aimed at folks who are taking their initial steps onto the housing ladder.
The bigger Harris trade, however, is to bet that she can avoid an escalation in trade tensions with China, in contrast to Trump’s tougher rhetoric about trade and tariffs…
Reda Farran is an analyst at finimize.
ii and finimize are both part of abrdn.
finimize is a newsletter, app and community providing investing insights for individual investors.
abrdn is a global investment company that helps customers plan, save and invest for their future.
These articles are provided for information purposes only. Occasionally, an opinion about whether to buy or sell a specific investment may be provided by third parties. The content is not intended to be a personal recommendation to buy or sell any financial instrument or product, or to adopt any investment strategy as it is not provided based on an assessment of your investing knowledge and experience, your financial situation or your investment objectives. The value of your investments, and the income derived from them, may go down as well as up. You may not get back all the money that you invest. The investments referred to in this article may not be suitable for all investors, and if in doubt, an investor should seek advice from a qualified investment adviser.
Full performance can be found on the company or index summary page on the interactive investor website. Simply click on the company's or index name highlighted in the article.