Commodities outlook: oil prospects and a gold price rally
Our financial markets analyst studies price swings and technical indicators for hints at future moves.
23rd April 2020 15:56
by Rajan Dhall from interactive investor
Our financial markets analyst studies price swings and technical indicators for hints at future moves.

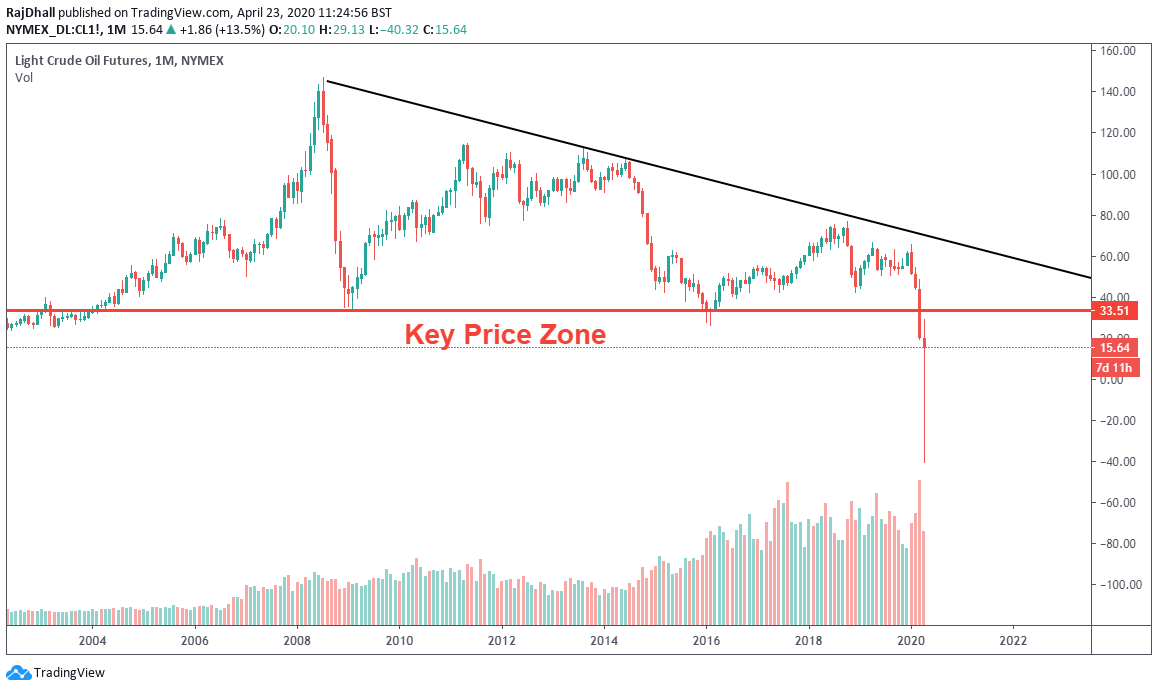
It's been a long week for commodities traders as the benchmark West Texas Intermediate (WTI) May futures contract nearly hit minus $40 a barrel!
A production cut agreed by the US, Saudi Arabia and Russia from the end of April appeared to tackle the problem of oversupply and lack of demand.
But OPEC+ nations needed to apply the agreed cuts straight away, not wait till the end of the month. This led to a lack of storage, with tankers at sea already full and inventory on dry land also at full capacity, so there was literally no place for the liquid gold to go.
This led to higher storage and transport costs, and physical oil being priced in minus numbers. This is not the first time this has happened in commodities, as milk and sugar has suffered similar issues in the past but nothing on this scale and at this volume.
- These oil stocks are rallying right now
- Oil for beginners: why oil prices move up and down
- Investing in oil: prices, dividends, shale firms, and stock tips
- Chart of the week: is Shell’s share price rally on borrowed time?
It remains to be seen how many oil companies will remain solvent during this period of low oil prices, as many of them are highly indebted. This will be a particular problem for some of the US shale producers who need WTI to be trading above $40 per barrel to remain solvent.
There has been an uptick in prices in recent sessions, but these companies will need a sustained increase to survive. The average oil price over the last 10 years or so is about $42 per barrel, so the producers desperately need a return to more normal levels.

Source: TradingView Past performance is not a guide to future performance
The gold price is benefitting from turmoil in oil markets and has pushed higher nicely. The interesting thing is that some of the correlations with other asset classes have been completely off.
This has been the case since the early stages of the coronavirus pandemic back in December last year. Gold has risen in line with stock markets and, also yesterday, the US dollar, indices and gold were all up at the same time.
In terms of macro markets, today’s UK purchasing managers' index (PMI), an economic trends indicator, was shocking, with both the UK and EU numbers comfortably under consensus estimates.
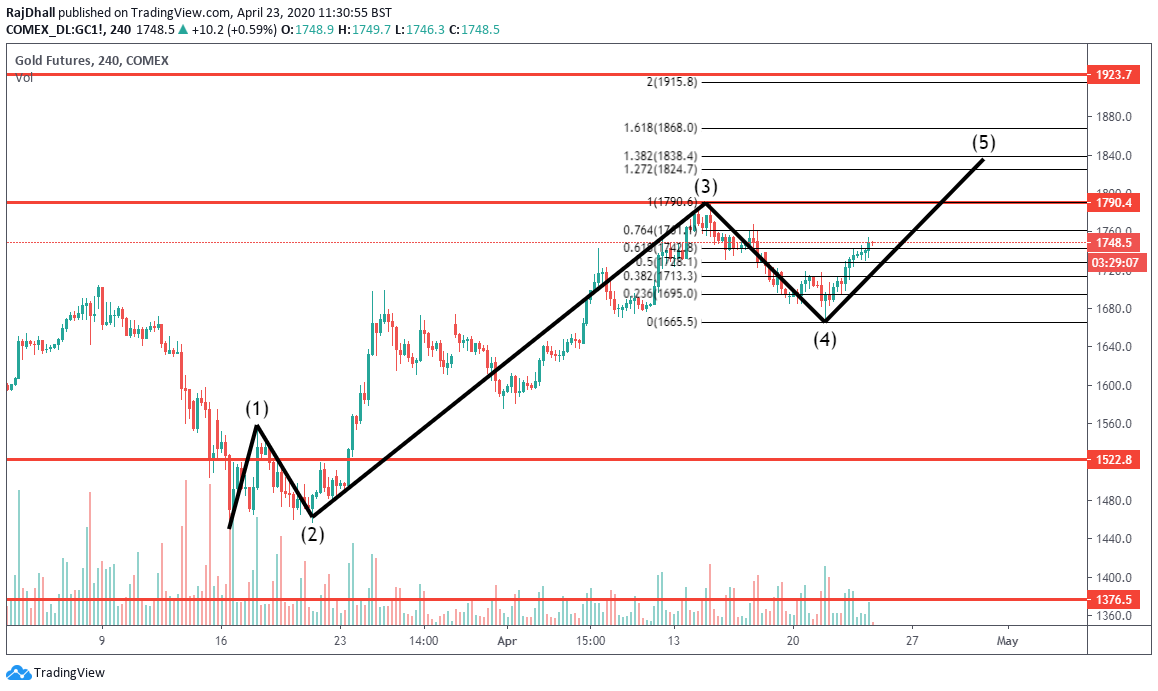
A look at the charts shows the gold price targeting a break higher past the previous wave high of $1,788.0 per ounce. If this gets taken out, then the $1,800 per ounce level could be a decent target, but the break needs to be made for confirmation of this.
Conversely, $1,759.9 per ounce is the 76.4% Fibonacci retracement of the wave down from the mid-April high which could be a resistance point. The price is very close to that level at the moment and, if it breaks, it will give a higher probability to the wave high $1,788 per ounce being tested.

Source: TradingView Past performance is not a guide to future performance
Rajan Dhall is a freelance contributor and not a direct employee of interactive investor.
These articles are provided for information purposes only. Occasionally, an opinion about whether to buy or sell a specific investment may be provided by third parties. The content is not intended to be a personal recommendation to buy or sell any financial instrument or product, or to adopt any investment strategy as it is not provided based on an assessment of your investing knowledge and experience, your financial situation or your investment objectives. The value of your investments, and the income derived from them, may go down as well as up. You may not get back all the money that you invest. The investments referred to in this article may not be suitable for all investors, and if in doubt, an investor should seek advice from a qualified investment adviser.
Full performance can be found on the company or index summary page on the interactive investor website. Simply click on the company's or index name highlighted in the article.