Commodities outlook: Kaz Minerals, Rio Tinto, copper analysis
We get a financial analyst’s view of the major metals and two popular mining stocks.
13th December 2019 13:41
by Rajan Dhall from interactive investor
We get a financial analyst’s view of the major metals and two popular mining stocks.

What a few days it has been for financial markets. The Tories won the election and we hear the US and China have agreed a "phase one" trade deal, although it is yet to be confirmed.
Markets in the late US session and the Asian markets overnight had a boost of good news on two fronts then. Social media ran stories that Washington had agreed to suspend tariffs on $160 billion in Chinese goods that had been due to come into effect on Sunday. This sent copper prices higher, then stock markets followed. China is also buying $50 billion of US agricultural goods in 2020.
It has been said that Trump could sign the deal later today after "signing off" on the proposals last night. Looking at the particulars, it seems that the US reportedly offered to halve tariff rates on about $350 billion (£260 billion) worth of Chinese goods, some of which had climbed as high as 25%. This is by no means the end of the saga and we will get more details in the coming hours.
Copper weekly chart
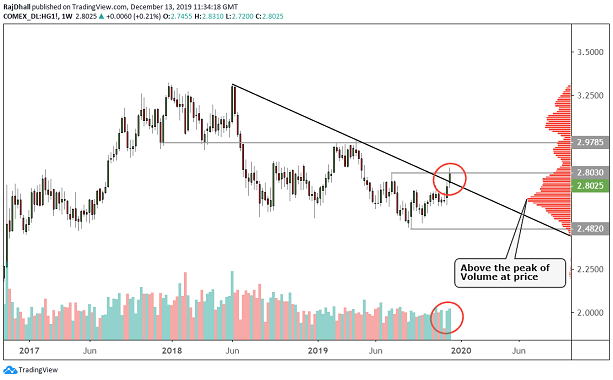
Concentrating on the charts now, we can see a strong move higher. It has taken a while but $2.80 per pound has been taken out and this week the market is 2.88% better, building on lasts week’s 3.14% rise.
The volume profile indicator on the right-hand side of the chart below shows the price is above the area where most contracts have been traded. This represents the bullish mood at the moment. The volume indicator at the bottom of the chart shows the market is very much behind this move higher, and it will be interesting to see volume on the COMEX derivatives exchange today.
There is also M&A activity in the sector, with reports that US-listed Freeport McMoRan is the subject of a takeover bid by Barrick Gold. Also, Chinese firm Jiangxi Copper have apparently been looking at Canada's First Quantum after taking an 18% stake earlier in the week. All of this had led to lots of bullishness in the sector.

Source: TradingView Past performance is not a guide to future performance
Kaz Minerals
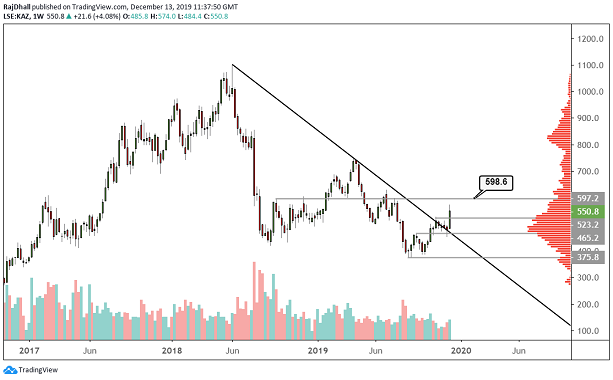
Kaz Minerals (LSE:KAZ) is a good barometer of copper in the UK, and recently we have seen a break to the upside as the global picture improves. The potential target for the bulls now must be the 600p level after 523p was taken out this week with decent volume. The trendline break on the chart was also a very bullish signal and it seems the technicals have been vindicated as they front-run the move.

Source: TradingView Past performance is not a guide to future performance
Rio Tinto
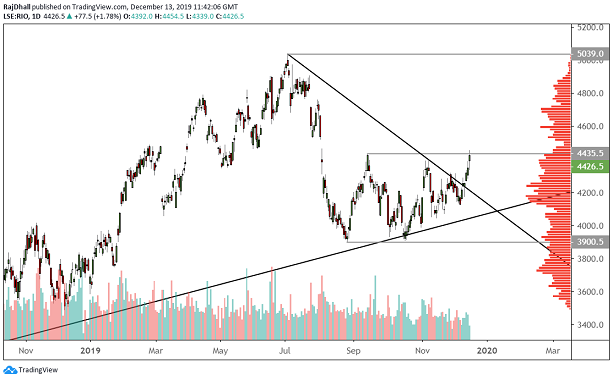
The daily chart for Rio Tinto (LSE:RIO) is now testing an important zone, so is one to keep on your radar. Rio is now testing the resistance zone at 4,435.5p and, if it breaks, it could move to the distribution between 4,435p and the highs at 5,039p.
The negative point on the chart at the moment is the volume. If the price does manage to break higher, the confirmation from the volume behind the move will be key.

Source: TradingView Past performance is not a guide to future performance
Rajan Dhall is a freelance contributor and not a direct employee of interactive investor.
These articles are provided for information purposes only. Occasionally, an opinion about whether to buy or sell a specific investment may be provided by third parties. The content is not intended to be a personal recommendation to buy or sell any financial instrument or product, or to adopt any investment strategy as it is not provided based on an assessment of your investing knowledge and experience, your financial situation or your investment objectives. The value of your investments, and the income derived from them, may go down as well as up. You may not get back all the money that you invest. The investments referred to in this article may not be suitable for all investors, and if in doubt, an investor should seek advice from a qualified investment adviser.
Full performance can be found on the company or index summary page on the interactive investor website. Simply click on the company's or index name highlighted in the article.