The wisdom of holding multiple emerging market trusts
Investment trusts in the emerging market sector are less correlated than you might expect, argues Kepler Trust Intelligence, which explores how investors can get genuine diversification from the sector
9th August 2024 14:00

In the past five years, particularly since the onset of the coronavirus pandemic, dramatic geopolitical and economic developments have led to observed decouplings between markets.
As we discuss below, data shows this is especially true within the emerging market (EM) sector. This shift is illustrated by widening correlations among many of these markets, with one prime example being China, where factors like the pandemic, geopolitical tensions, and a property crisis have prompted investors to seek out alternatives.
As a result, a sector that had been growing more correlated to developed markets (DM) is now offering investors more uncorrelated options than it has in years – and many different strategies that are uncorrelated to one another.
In our view, this presents a compelling opportunity for diversification, especially within emerging markets, even in an increasingly interconnected world.
How has the DM vs EM relationship changed?
We began by examining how DMs and EMs have interacted with each other, specifically focusing on their correlation, drawing initially on research conducted by the CFA Institute (Horstmeyer et al., 2022). Correlation, in this context, measures how closely two indices move in relation to each other, with correlation coefficients ranging from -1.0 (a perfectly inverse relationship) to 1.0 (a perfectly synchronised relationship). In theory, if you hold two investments that have correlations below 1.0, it can help reduce your portfolio’s overall risk profile.
The CFA Institute's research highlighted a significant shift in the correlation between global equity markets in recent decades (1980 to 2010). During the 1980s, the average correlation coefficient among the indices it studied, and for which the data was available, was 0.25. Of the 45 correlation coefficients in the sample for that decade, eight were negative. However, as global markets became more interconnected through globalisation, the average correlation increased – reaching 0.30 in the 1990s and 0.59 by the 2000s – with no negative correlations observed by the end of this period.
The indices examined as part of this research included a mix of DM and EM indices. To explore how this trend evolved after 2010, we focused on the correlation between the MSCI EM Index, representing 24 EM countries, and the MSCI World Index, representing 23 DM countries. We analysed the one-year rolling correlation between these two indices, with the MSCI World Index as the baseline (correlation of 1.0).
Our findings, shown below, reveal that the average correlation of the MSCI EM Index to the MSCI World Index since 2010 on a rolling one-year basis, has been around 0.7. The relationship between these markets has become more correlated, with some arguing that globalisation has continued to drive the increase, as economic and financial interdependence has grown. That said, given recent global events, such as the coronavirus pandemic, as well as geopolitical conflicts in Europe and the Middle East, we can see distinct periods where correlations have decreased.
ROLLING CORRELATION
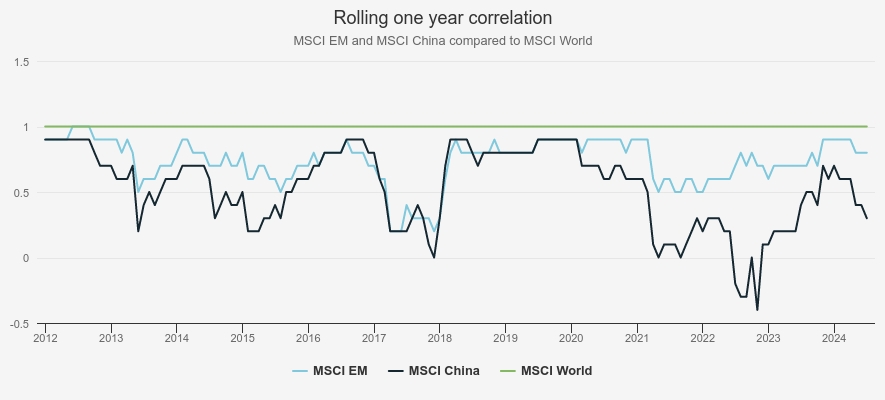
Source: Morningstar.
We think this indicates that despite the overall trend toward higher correlation, there are still opportunities for diversification. The onset of the global pandemic in early 2020 accelerated the decoupling among global equity markets and transformed their relationship to one another, ushering in what may be a regime change in world finance. Varying health, economic, and policy responses across different countries led to a reduction in correlations between EMs and DMs, as they reacted uniquely to the challenges and opportunities presented.
The pandemic also affected different sectors unevenly, which led to the levels of interdependence between markets reduce somewhat. Many markets have higher concentrations in growth sectors such as information technology, such the US or Taiwan. Meanwhile, other markets remain dominated by the old economy sectors such as commodities and banking – the UK in developed markets and Brazil in emerging markets would be two examples.
In 2022 and 2023, conflicts in Europe and the Middle East further influenced these correlations. Conflicts heighten geopolitical risk, causing investors to re-evaluate their portfolios and can often lead to a flight-to-safety response, with some investors moving capital from riskier EM assets to perceived safer DM assets. However, one outcome from these conflicts was mass disruption in global energy markets. Latin American countries, who have more access to raw commodities benefitted, whilst others, particularly those in Europe who have been reliant on Russian or Middle Eastern energy supplies over the years, were hit hard.
Additionally, observant readers will note our inclusion of China in the rolling correlation chart above. We think that supply chain disruptions and Covid-19 countermeasures in China, could also be potential drivers of global equity markets decoupling. As the largest economy in the EM sector, China's economic trajectory has shifted from a high-growth story to one fraught with investor concerns due to factors like geopolitical risks, uneven recovery post-Covid, and very different political structures.
At its peak, China represented around 40% of the MSCI EM Index, but now equates to around 25%, driven largely by the issues above. By judging China’s correlations in the post-Covid-19 era, we can see its showing a lower correlation with DMs, which was expected, but also note its increasing decoupling from other EMs.
Another big driver behind China’s decoupling is the re-shoring/friend-shoring trend. A combination of political issues, particularly since the onset of the pandemic in 2020, has prompted many to seek alternatives and reduce their reliance on its economy. Mexico is potentially a beneficiary here, as certain US companies that have historically conducted business within China are looking to bring their manufacturing closer to home. Furthermore, there are other companies looking to retain a central Asian presence for things like stronger supply chains, but rather than China which poses many risks currently, eyes are turning to the likes of Vietnam or Indonesia. This should bring greater dependence between western multinationals and these countries, while reducing the interdependence between these companies and China, which should in theory have an effect on market correlations.
Emerging market correlation
Emerging Asian countries, in particular China, India, and Taiwan are key components of emerging markets indices, but they also include emerging economies outside of Asia like Latin America and Europe. There are 24 EM countries in total and many emerging market funds can invest in the frontier universe too, which brings many more countries into play. If we include the Asian sectors (most members of which can invest in developed countries too, although are predominantly EM-focused) there are around 36 equity investment trusts investing across the region, along with numerous open-ended equivalents. Given this diversity, when it comes to exploring EM investment trusts, most, if not all managers say, “We offer something very different” or “Our strategy is truly differentiated from our own EM peers”.
Consequently, we ran a full correlation matrix on all the trusts in the EM sector in order to assess the level of diversification / correlation you can actually attain investing in EM, drawing out the most differentiated elements and most uncorrelated strategies. We ran the matrix over five years, using cum fair NAV monthly returns, and given the large list of trusts, we’ve included a full list here. What we have done below, however, is show the 15 lowest correlation pairs that emerge from this list.
15 LOWEST CORRELATION PAIRS IN THE EM SECTOR
Source: Morningstar. Past performance is not a reliable indicator of future results.
One clear pattern that emerged is the notably low correlation of China-focused trusts with the broader EM sector. In fact, the lowest correlated pairs all involved China-focused investment trusts, with four of these showing negative correlations. We note there are only three trusts in the AIC China/Greater China sector — Baillie Gifford China Growth Trust Ord (LSE:BGCG),Fidelity China Special Ord (LSE:FCSS)and JPMorgan China Growth & Income Ord (LSE:JCGI). It is true that BGCG changed its mandate in September 2020, so we would place less emphasis on the results involving this trust, but it's clear that Chinese investments have been much less correlated to other options in the space.
Each trust focuses on investing in Chinese companies that the respective managers believe have strong long-term potential and significant exposure to the opportunities presented by China’s vast market. In our view, a driver behind the low correlation can largely be attributed to the volatility of China’s stock market in recent years. A series of issues post-pandemic, such as closer ties with Russia, a property crisis, ongoing geopolitical tensions, and a weaker-than-expected recovery after Covid restrictions were lifted, have all contributed to the poor performance of China's stock market, particularly since the early part of 2022 to now. As a result, many investors have become more cautious, seeking alternatives either through specific country allocations (like India or Vietnam) or indirect exposure via semiconductor companies in Taiwan and Japan, or luxury goods businesses in Europe.
Out of the four negative correlations, three pertain to the Gulf Investment Fund, which focuses on investments solely in the Middle East. In this case, given differing markets and how each economy ticks, negative correlation isn’t all that surprising. However, the fourth negative correlation is to Ashoka India Equity Investment Ord (LSE:AIE).
India, broadly speaking, has seen surging exports as countries shift manufacturing away from China, and its stock market has performed exceptionally well over the last two years. AIE has demonstrated strong returns over this period, delivering NAV total returns of 48.5%, ahead of its benchmark. Whilst valuations in certain parts of India appear elevated, the AIE team have leveraged their extensive resources to uncover alpha-generating opportunities across the market cap spectrum, without relying solely on companies with stretched multiples. This is particularly true in the small- and mid-caps parts of the market, where the team see the greatest potential for gems.
This initial analysis highlights that whilst China indeed presents an uncorrelated option for investors, we think it is crucial not to overlook the broader EM landscape. With 24 countries making up the EM index, there's a wealth of differentiated opportunities to explore, so let’s dig deeper and see what else we can uncover.
What happens without China?
After removing the trusts within the China sector, a much broader range of lowly correlated trusts came to light, see here. Once China is stripped out, given its significant weighting in the EM index but also its economic turbulence over the last few years, clearly there are fewer extreme correlation gyrations. That said, even though the extreme fluctuations in EM correlations are less pronounced without China, some intriguing patterns and pairs still stand out. To make this analysis more digestible, we've chosen to highlight different EM sector correlations, focusing on those that are particularly noteworthy.
EM SECTOR CORRELATIONS
| Morningstar Investment Trust sectors | 1 | 2 | 3 | 4 | 5 | 6 | 7 |
| 1 Asia Pacific | 1.00 | ||||||
| 2 Asia Pacific Equity Income | 0.93 | 1.00 | |||||
| 3 Asia Pacific Smaller Companies | 0.84 | 0.83 | 1.00 | ||||
| 4 Country Specialist | 0.75 | 0.67 | 0.77 | 1.00 | |||
| 5 Global Emerging Markets | 0.86 | 0.83 | 0.88 | 0.79 | 1.00 | ||
| 6 India / Indian Subcontinent | 0.57 | 0.50 | 0.79 | 0.59 | 0.76 | 1.00 | |
| 7 Latin America | 0.44 | 0.50 | 0.59 | 0.39 | 0.66 | 0.51 | 1.00 |
Source: Morningstar. Past performance is not a reliable indicator of future results.
Starting with the lowest sector correlation between the country specialist sector and Latin America, we observe an interesting dynamic. The country specialist sector includes four trusts, three of which invest in Vietnam, making up roughly 95% of the total net assets in the sector, while the Latin America sector is represented by just one trust. At a top level, the differing economic drivers of these regions largely explain the lower correlation between them. For example, Latin America's economy is heavily influenced by commodity prices, whereas Vietnam's economy is driven primarily by domestic consumption and exports.
Within these sectors, BlackRock Latin American Ord (LSE:BRLA), the sole representative Latin America trust, shows low correlated against all country specialist trusts, including Vietnam Enterprise Ord (LSE:VEIL). This divergence is primarily due to each trust’s focus on entirely different regions, but there are deeper insights when examining the underlying portfolios.
VEIL invests in Vietnamese companies poised to capitalise on the country's long-term growth potential. Moreover, Vietnam is increasingly seen as a key manufacturing partner for global corporations looking for alternatives to China. For instance, Nvidia announced that it would partner with local tech giant (and VEIL holding) FPT Corporation to build a $200m ‘AI factory’. Vietnam has the advantage of strong trading links with both the US and China, creating opportunities within its corporate sector.
Similarly, although BRLA focuses on a different part of the world, it also invests in companies benefitting from the global shift away from China. For example, Mexico, which is the second-largest sector focus within BRLA’s portfolio, stands to gain significantly from the near-shoring trend as US companies seek to relocate manufacturing closer to home. Both trusts are investing in companies benefitting from the same trends, but given the areas of focus, size of companies they target and manager individuality, the trusts remain lowly correlated suggesting that there would be a greater reduction in volatility and risk by adding these trusts together.
Another sector showing low correlation is India. AIE demonstrates some of the lowest correlations across our matrix, which is expected given its single-country focus and unique investment strategy. Even when compared to non-India-focussed trusts, but those that have meaningful exposure, its strategy, particularly the bias to small and mid-caps, means it has one of the lowest average correlations across our matrix. Looking at Fidelity Emerging Markets Ord (LSE:FEML), for example, AEI has a correlation of 0.53, indicating that combining these trusts could potentially reduce overall portfolio volatility and risk.
Through the FEML portfolio, managers Nick Price and Chris Tennant adopt a flexible, go-anywhere approach within the EM space, including diverse exposure to India. Its India holdings, particularly in the financial sector, share some common stocks with AIE, such as ICICI Bank Ltd ADR (NYSE:IBN) and HDFC Bank Ltd ADR (NYSE:HDB). However, correlation between the two is relatively low. Where the two trusts diverge is in their investment strategies. AIE’s strength lies in identifying high-potential opportunities within the small and mid-cap space, leveraging its extensive resources in India. Meanwhile, FEML benefits from the flexibility to engage in both long and short positions, a capability unmatched in the AIC EM sector.
Turning our attention to the Asia Pacific Smaller Companies sectors, there are some notable correlations that are worth highlighting. One example is Fidelity Asian Values Ord (LSE:FAS), managed by Nitin Bajaj, which primarily invests in small-cap companies across the Asian region. While this is similar to its peers in the sector, FAS stands out due to Nitin's distinctive investment strategy. Nitin employs a value-oriented approach, which is very different from his peers which are more core or growth focused. Furthermore, of the trust’s top ten positions, no holdings appear in its formal benchmark, the MSCI AC Asia ex-Japan Small Cap Index. In our view, this strategy leads to some intriguing correlation dynamics within the sector.
Despite being in the same sector and targeting similar market caps, FAS has a correlation of 0.83 with abrdn Asia Focus plc (LSE:AAS) and 0.86 with Scottish Oriental Smaller Cos Ord (LSE:SST). While these correlations might seem relatively high compared to those we’ve discussed elsewhere; they actually indicate that FAS maintains a significant degree of independence from its sector peers. A correlation of 0.83 or 0.86, conceptually means that 0.83 x 0.83 (and 0.86 x 0.86) of the variation in a trust’s past returns is explained by the movements of the other trusts, i.e. 69% and 74%, respectively. This means that there is scope for around a 30% and 25% difference on average in returns, a meaningful difference, in our view. As such, investors can expect FAS to look different to peers and, at times, perform differently as well.
Conclusion
In this article, we have identified trusts with notably low correlations and explored the sources of their differentiation. Depending on your investment objectives, there are certainly options within the EM space that offer lower correlations. Single-country-focused trusts often provide the lowest correlations, but others use different strategies to further set themselves apart. Notably, some trusts that invest in companies poised to benefit from the same key EM trends maintain low correlations, underscoring that exposure to multiple emerging markets can offer genuine diversification within a global portfolio.
Kepler Partners is a third-party supplier and not part of interactive investor. Neither Kepler Partners or interactive investor will be responsible for any losses that may be incurred as a result of a trading idea.
These articles are provided for information purposes only. Occasionally, an opinion about whether to buy or sell a specific investment may be provided by third parties. The content is not intended to be a personal recommendation to buy or sell any financial instrument or product, or to adopt any investment strategy as it is not provided based on an assessment of your investing knowledge and experience, your financial situation or your investment objectives. The value of your investments, and the income derived from them, may go down as well as up. You may not get back all the money that you invest. The investments referred to in this article may not be suitable for all investors, and if in doubt, an investor should seek advice from a qualified investment adviser.
Full performance can be found on the company or index summary page on the interactive investor website. Simply click on the company's or index name highlighted in the article.
Important Information
Kepler Partners is not authorised to make recommendations to Retail Clients. This report is based on factual information only, and is solely for information purposes only and any views contained in it must not be construed as investment or tax advice or a recommendation to buy, sell or take any action in relation to any investment.
This report has been issued by Kepler Partners LLP solely for information purposes only and the views contained in it must not be construed as investment or tax advice or a recommendation to buy, sell or take any action in relation to any investment. If you are unclear about any of the information on this website or its suitability for you, please contact your financial or tax adviser, or an independent financial or tax adviser before making any investment or financial decisions.
The information provided on this website is not intended for distribution to, or use by, any person or entity in any jurisdiction or country where such distribution or use would be contrary to law or regulation or which would subject Kepler Partners LLP to any registration requirement within such jurisdiction or country. Persons who access this information are required to inform themselves and to comply with any such restrictions. In particular, this website is exclusively for non-US Persons. The information in this website is not for distribution to and does not constitute an offer to sell or the solicitation of any offer to buy any securities in the United States of America to or for the benefit of US Persons.
This is a marketing document, should be considered non-independent research and is subject to the rules in COBS 12.3 relating to such research. It has not been prepared in accordance with legal requirements designed to promote the independence of investment research.
No representation or warranty, express or implied, is given by any person as to the accuracy or completeness of the information and no responsibility or liability is accepted for the accuracy or sufficiency of any of the information, for any errors, omissions or misstatements, negligent or otherwise. Any views and opinions, whilst given in good faith, are subject to change without notice.
This is not an official confirmation of terms and is not to be taken as advice to take any action in relation to any investment mentioned herein. Any prices or quotations contained herein are indicative only.
Kepler Partners LLP (including its partners, employees and representatives) or a connected person may have positions in or options on the securities detailed in this report, and may buy, sell or offer to purchase or sell such securities from time to time, but will at all times be subject to restrictions imposed by the firm's internal rules. A copy of the firm's conflict of interest policy is available on request.
Past performance is not necessarily a guide to the future. The value of investments can fall as well as rise and you may get back less than you invested when you decide to sell your investments. It is strongly recommended that Independent financial advice should be taken before entering into any financial transaction.
PLEASE SEE ALSO OUR TERMS AND CONDITIONS
Kepler Partners LLP is a limited liability partnership registered in England and Wales at 9/10 Savile Row, London W1S 3PF with registered number OC334771.
Kepler Partners LLP is authorised and regulated by the Financial Conduct Authority.