What does higher inflation volatility mean for the future of diversification?
We believe the longer-term inflation regime will be one of higher inflation volatility. This is likely to affect the bond/equity correlation, making portfolio diversification more challenging.
10th May 2024 09:40

Historically, inflation has gone through regimes
Inflation tends to move in regimes over long periods. For example, from the post-Volker era until 2020, the global economy experienced a period of low inflation, with various positive supply-side shocks. This included globalisation (China exporting deflation), the formation of the EU single market, declines in global tariffs, technological developments improving productivity, de-unionisation of labour forces and de-regulation.
Relatively benign inflation hasn’t always been the case. During the 1970s, for example, we saw a regime of high and volatile inflation. This was driven by loose monetary policy (collapse of Bretton Woods) and a series of supply-side shocks, such as in the oil market.
Higher inflation volatility is likely to stay
We believe we’re entering a regime of higher inflation volatility. This should cause more frequent changes to central bank policy (bond volatility). The driver of this view is the increased chance of negative supply-side shocks, detailed below
Rising geopolitical tensions (competition between China/US) – lead to a retracement in globalisation (tariffs/regulations/on-shoring supply chains/commodity hoarding, etc.).
Chart 1: Rising geopolitical uncertainty
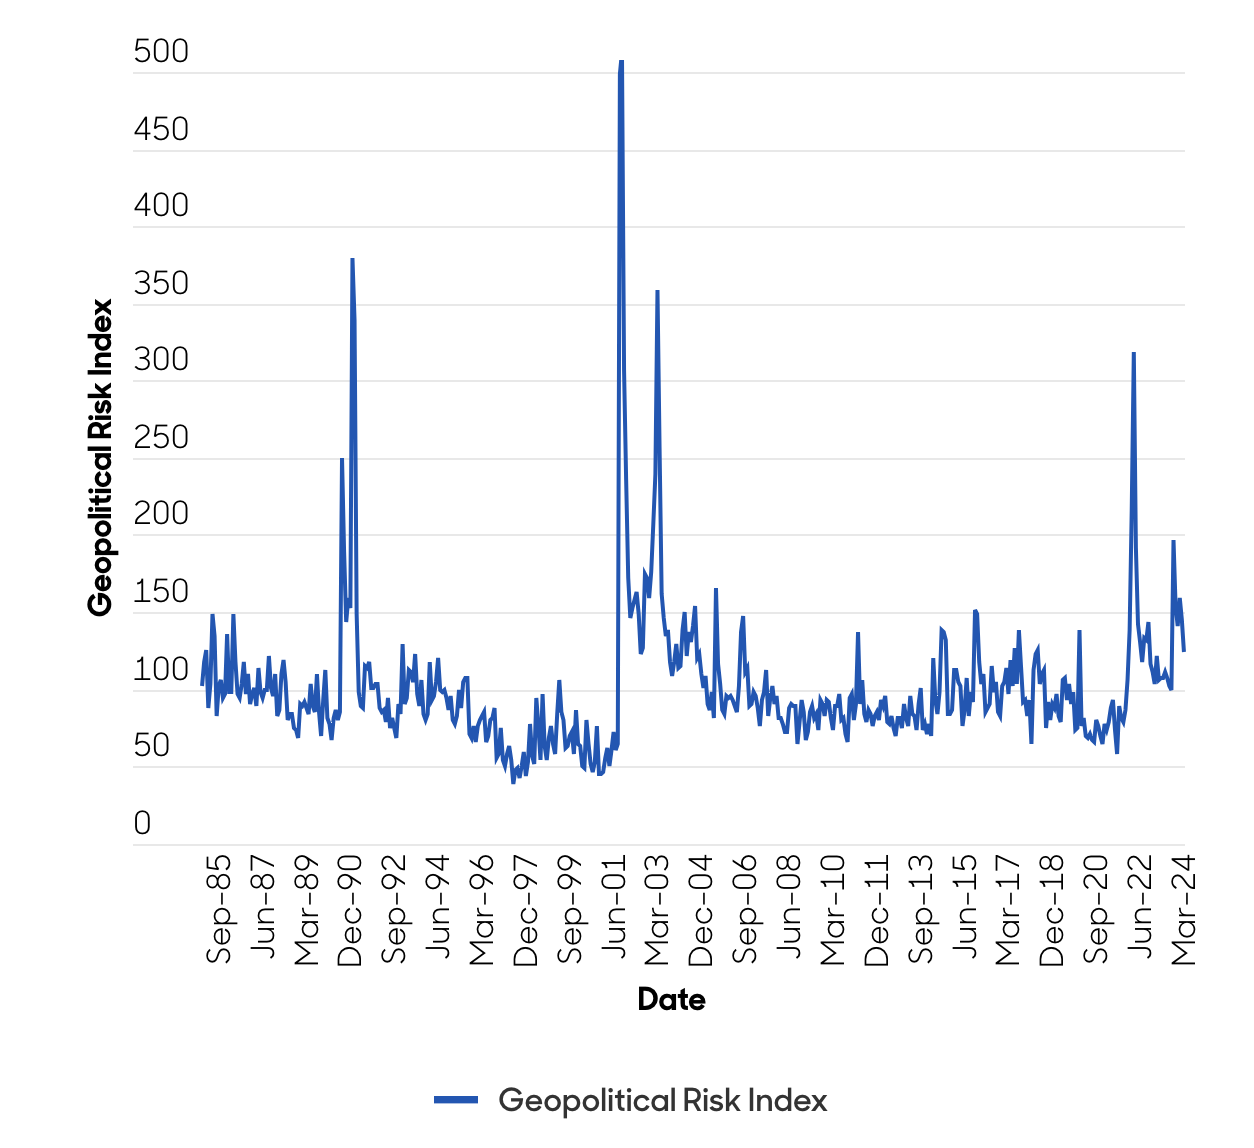
Source: Caldara and Iacoviello GPR index, 2024.
Climate change – government policy/more extreme weather events.
Changes in government policy – a rise in government debt and less fiscal conservatism. Since the pandemic, we’ve seen a material increase in government debt and few signs of fiscal restraint despite a very strong economic and employment environment over the last couple of years. In the US, for example, the fiscal deficit is expected to average greater than 6% of gross domestic product over 2023-24, despite an unemployment rate that is forecast to average less than 4%.
Chart 2: Little fiscal restraint in the US, despite a strong economy/labour market
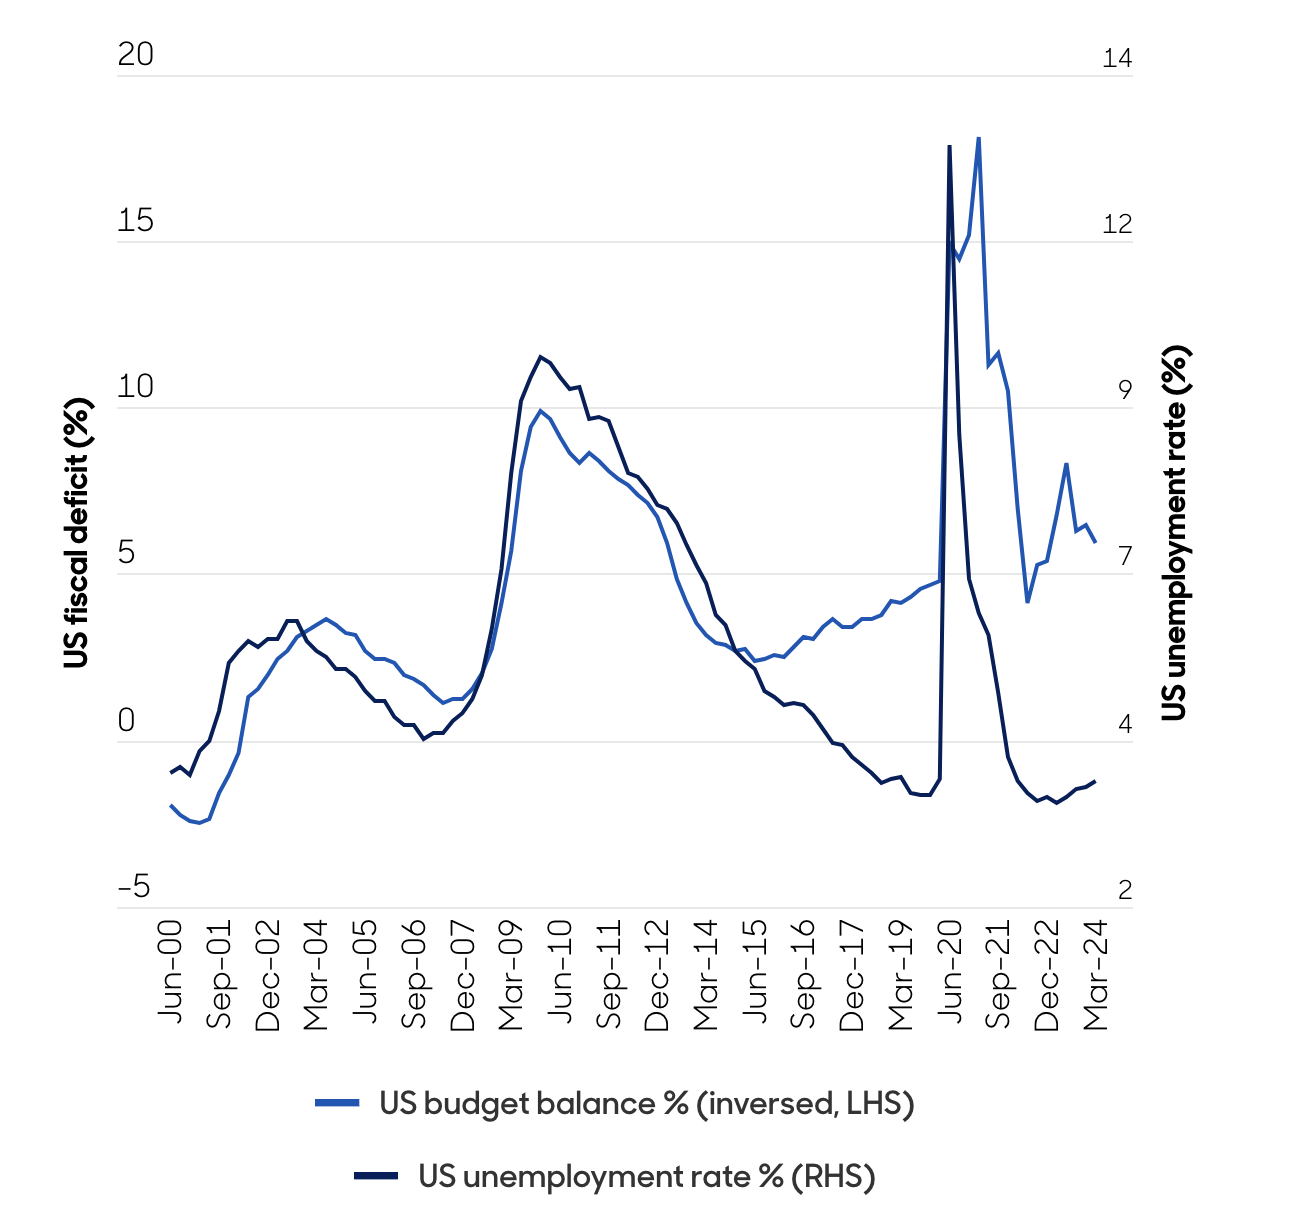
Source: Bloomberg, 2024 For illustrative purposes only. No assumptions regarding future performance should be made.
A new challenge for central banks
Negative supply-side shocks are more difficult for central banks to navigate than demand-side shocks. This is because they affect growth (down) and inflation (up) differently – which means central banks must prioritise stabilising inflation or growth. Various central banks are likely to approach this differently, and given the high level of government debt globally, there’s considerable political pressure on central banks to keep bond yields low (government debt costs).
What does this mean for diversification?
Because demand shocks push growth and inflation in the same direction, they tend to propel bond and equity prices in different directions (negative correlation): that is, when growth is strong equity prices tend to rise while bond prices often fall. As illustrated below, this has been the case for much of the last 30 years and enables investors to benefit from the only free lunch in markets – diversification.
Chart 3: Most of the past 30 years saw a negative correlation between bonds and equities
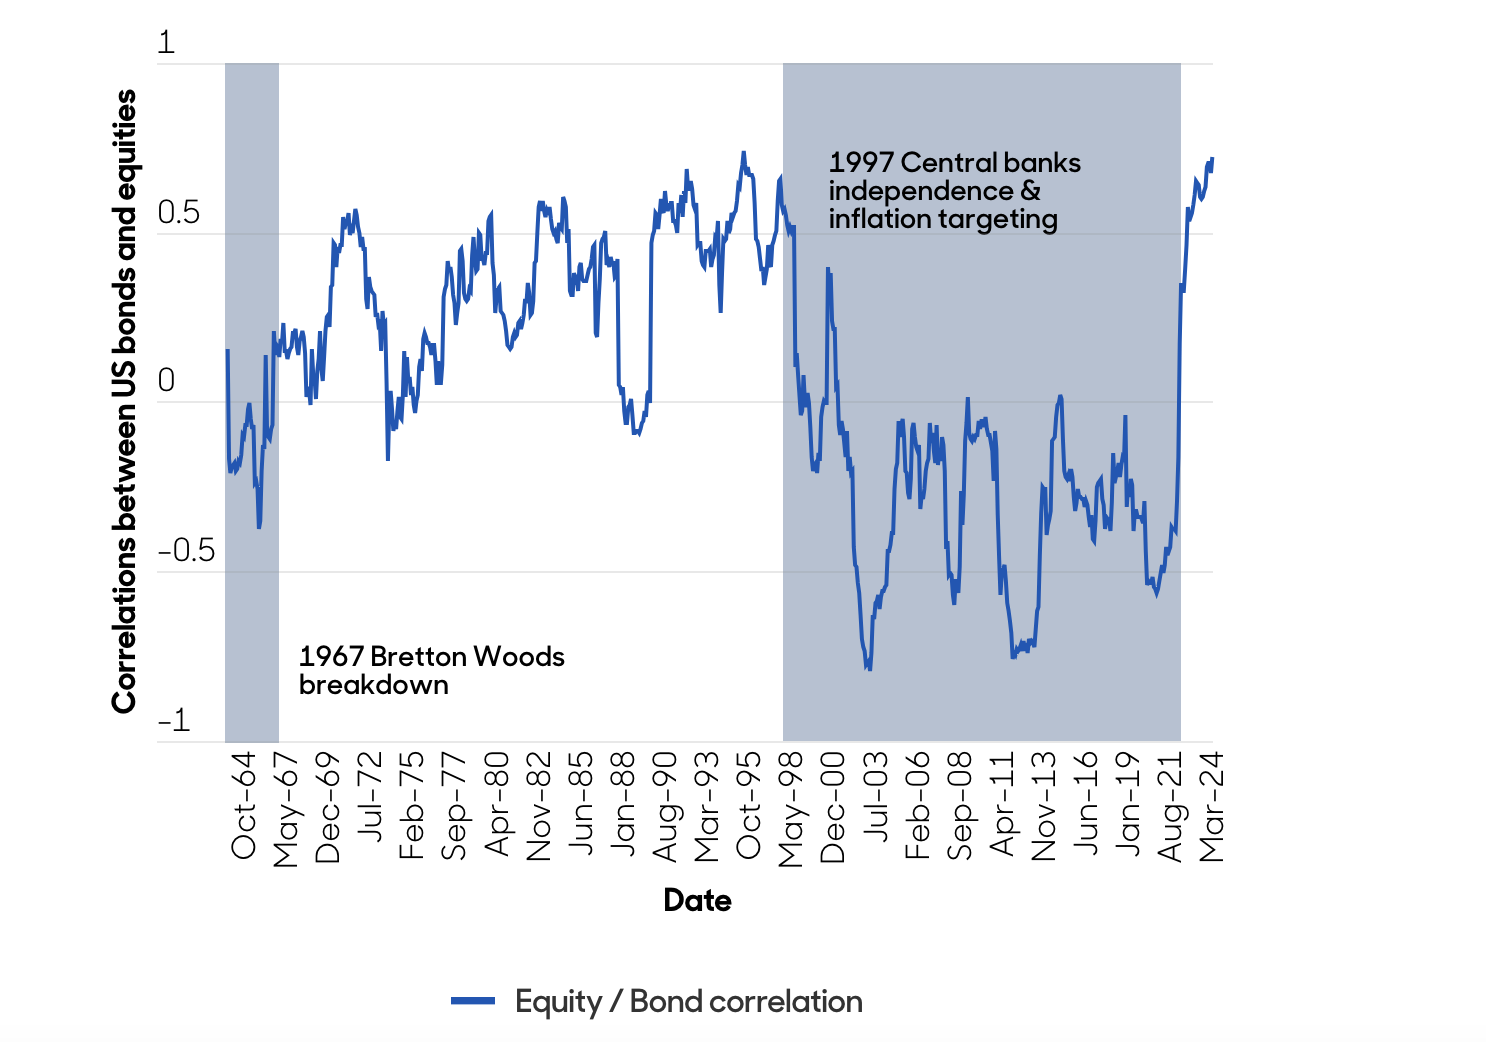
Source: Bloomberg data, 2024. For illustrative purposes only. No assumptions regarding future performance should be made.
Supply-side shocks are different, as they push growth and inflation in opposite directions and therefore push bond and equity prices in the same direction (positive correlation). This has been the case for much of the last couple of years and undermines the standard portfolio diversification characteristics. For the majority of the pre-Volker era, bonds and equities had a positive correlation.
Taking the example of a 60% allocation to US equities and a 40% allocation to US government bonds, rebalanced monthly, the chart shows the ratio of the net portfolio volatility and the sum of the standalone volatility of the assets held in the portfolio. The ratio is the diversification benefit between the two assets.
Chart 4: The diversification benefit of combining bonds and equities has fallen since the pandemic as inflation volatility has increased
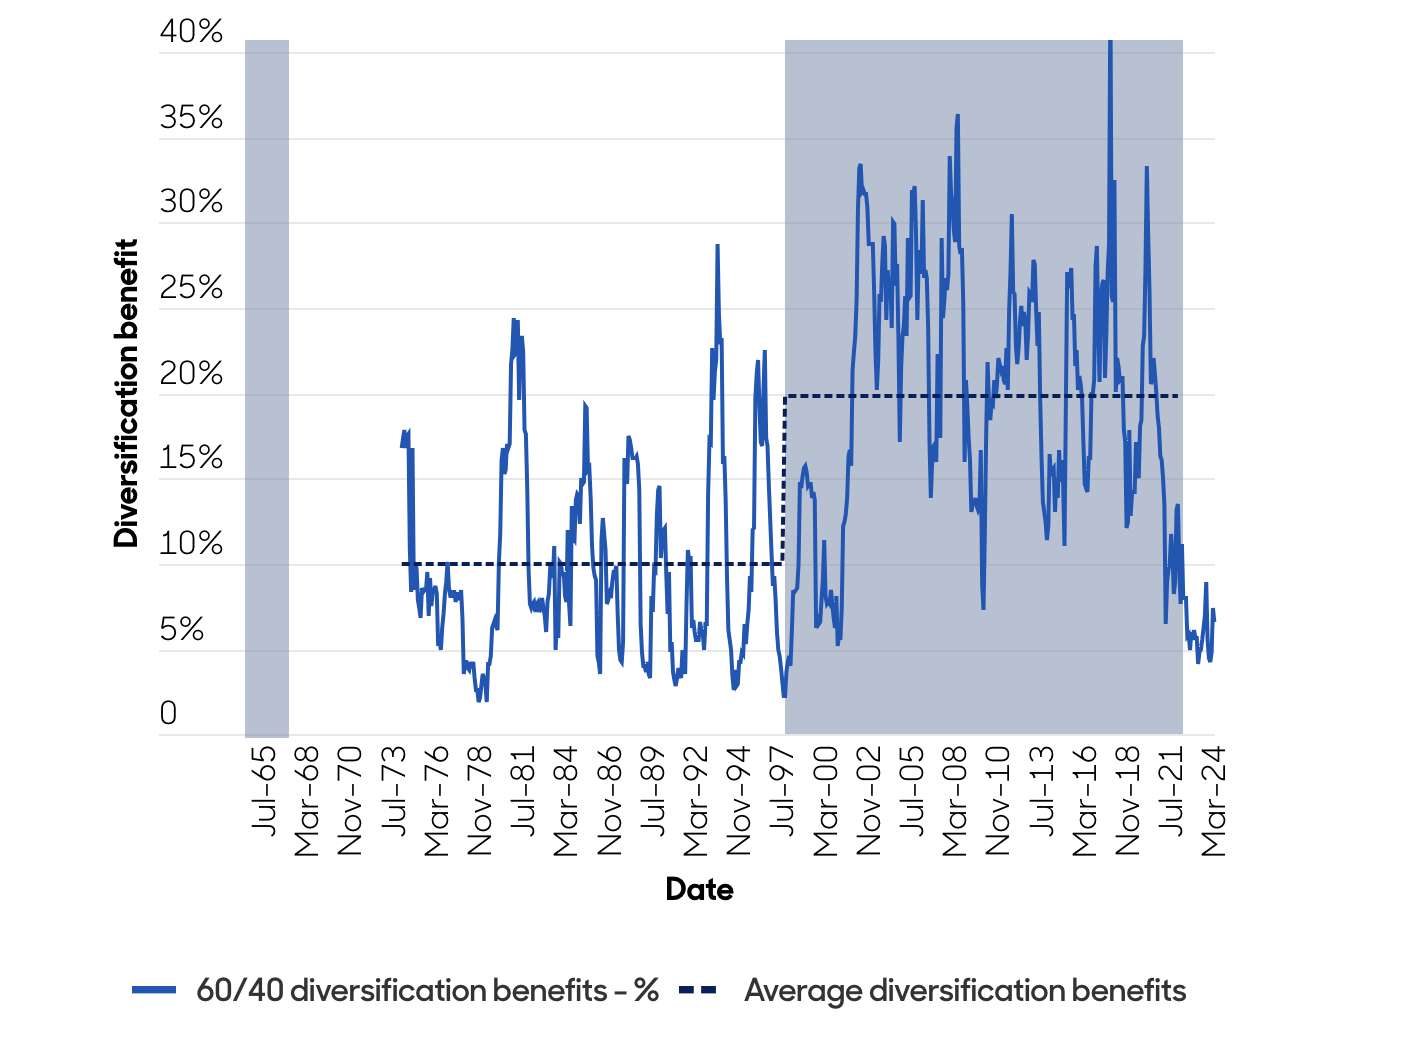
Source: Bloomberg data, 2024. For illustrative purposes only. No assumptions regarding future performance should be made.
Implications
If inflation volatility is higher than in the past 30 years, it’s unlikely that combining bonds/equities will yield the same diversification benefits as in the past.
Investors seeking to improve risk-adjusted returns should focus on finding alternative low-correlated assets/strategies.
Thomas Maxwell and Guillaume Delpratare investment directors at abrdn.
ii is an abrdn business.
abrdn is a global investment company that helps customers plan, save and invest for their future.
These articles are provided for information purposes only. Occasionally, an opinion about whether to buy or sell a specific investment may be provided by third parties. The content is not intended to be a personal recommendation to buy or sell any financial instrument or product, or to adopt any investment strategy as it is not provided based on an assessment of your investing knowledge and experience, your financial situation or your investment objectives. The value of your investments, and the income derived from them, may go down as well as up. You may not get back all the money that you invest. The investments referred to in this article may not be suitable for all investors, and if in doubt, an investor should seek advice from a qualified investment adviser.
Full performance can be found on the company or index summary page on the interactive investor website. Simply click on the company's or index name highlighted in the article.