This valuation expert swears by these three simple rules
Professor and author Aswath Damodaran swears by just three simple lessons for valuation research. Come to grips with them for yourself and you’ll be able to value any company or stock just as effectively as the valuation genius himself.
9th November 2023 12:43
by Reda Farran from Finimize

Investment opportunities arise when a stock’s price is below its value, with a catalyst on the horizon that could narrow that gap.
You can work out a stock’s value with a simplified discounted cash flow model, which you can build using the four key drivers of value: revenue growth, profit margins, investment efficiency, and riskiness.
A good valuation isn’t just based on numbers, it also has a story – so make sure you embed a narrative into your valuation model.
Professor and author Aswath Damodaran is one of the world’s leading experts in valuation. He’s spent a career diving deep into the intricacies of determining the current worth of a company or asset. But he swears by just three simple lessons for anyone wanting to do their own valuation research. If you come to grips with them for yourself, you’ll be able to value any company or stock just as effectively as the valuation genius himself…
Lesson 1: Valuing a stock isn’t the same as pricing a stock.
Or, as Warren Buffett once said, “Price is what you pay. Value is what you get.”
In its simplest form, the value of a stock is the sum of all its expected future cash flows, discounted back to today at a rate that reflects the riskiness of the company. Value is driven by factors like revenue growth, profit margins, and investment efficiency (more on that in a second). If you’re trying to value a stock (as opposed to trying to price it), building a discounted cash flow (DCF) model on the company is a more theoretically sound way to go.
The priceof a stock, on the other hand, is driven by factors like momentum, news, investor mood, market swings, and behavioral biases. If you’re looking at a company and you multiply its profits by a price-to-earnings (P/E) ratio taken from a stock in the same sector, you’re basically pricing it. That’s because the P/E ratio of a similar stock captures all those factors. Tech stocks, for example, traded at lofty P/E ratios during the dotcom bubble, while bank stocks traded at depressed levels right after the 2008 financial crisis – in each instance reflecting investors’ moods and big market swings.
So it’s important to see whether there’s a gap between value and price when you invest. Ideally, you want to buy a stock when its price is below its value. And if you can also foresee some “catalyst” – for example, the company being acquired, say, or launching a share buyback program – that could cause the gap between price and value to narrow, all the better.
Lesson 2: There are four key drivers of value.
DCF models are the preferred valuation method, and, yes, they do have a reputation for being complicated and time-consuming to build. But they don’t have to be if you simplify them to solely focus on the key drivers of value.
Recall we said that the value of a company is the sum of all its expected future cash flows, discounted back to today at a rate that reflects the riskiness of the company. You can see all of that in the equation below:
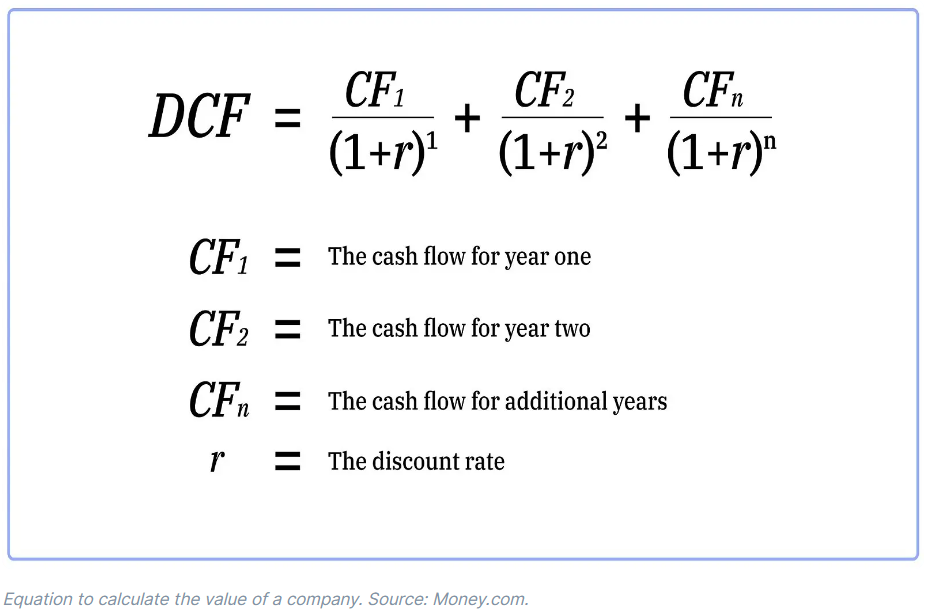
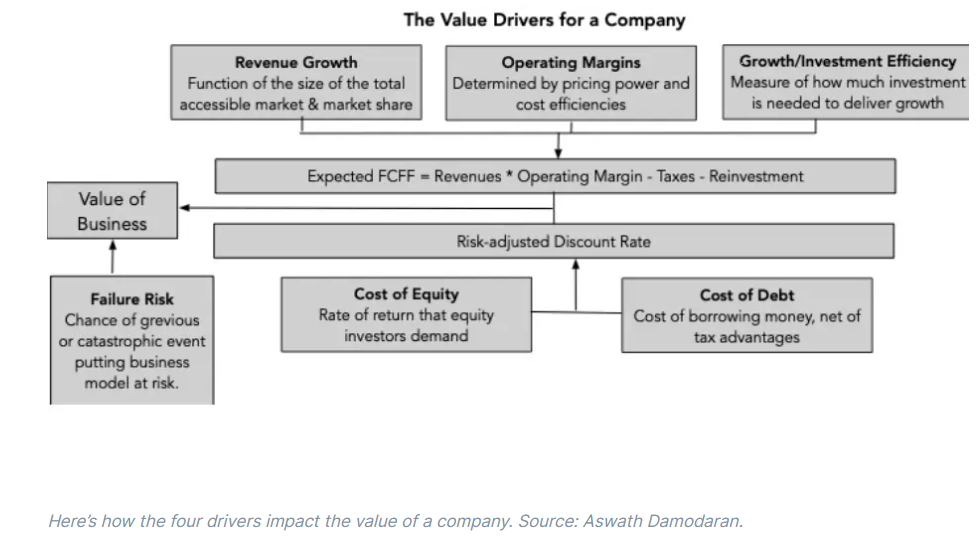
Damodaran has used this equation to highlight four key drivers of value:
- Revenue growth (the faster it is, the higher the company valuation)
- Profit margin (the bigger it is, the higher the valuation)
- Riskiness (the lower it is, the higher the valuation)
- Investment efficiency (the better it is, the higher the valuation)
The first three drivers are relatively straightforward. As for investment efficiency, just know that in order for companies to grow revenues, they need to invest in equipment, software, research and development, raw materials, and so on. Companies that are more investment efficient generate more revenue for every dollar of capital they invest, and they’re rewarded with higher valuations. You can measure investment efficiency using the sales-to-invested-capital ratio (revenue / ).
“Riskiness”, meanwhile, has two dimensions. First, there’s the operating risk of the business. This is basically the uncertainty around the firm’s future cash flows and is captured by the company’s cost of capital (which is also the rate used to discount those cash flows to the present). A higher cost of capital leads to lower company value. Second, there’s the risk that the company won’t actually survive. This is called risk of failure, with a higher risk of failure leading to lower company value.
Now you’re probably wondering how you might actually put this into practice and build a quick DCF model. So here’s a simplified example, using a hypothetical company.
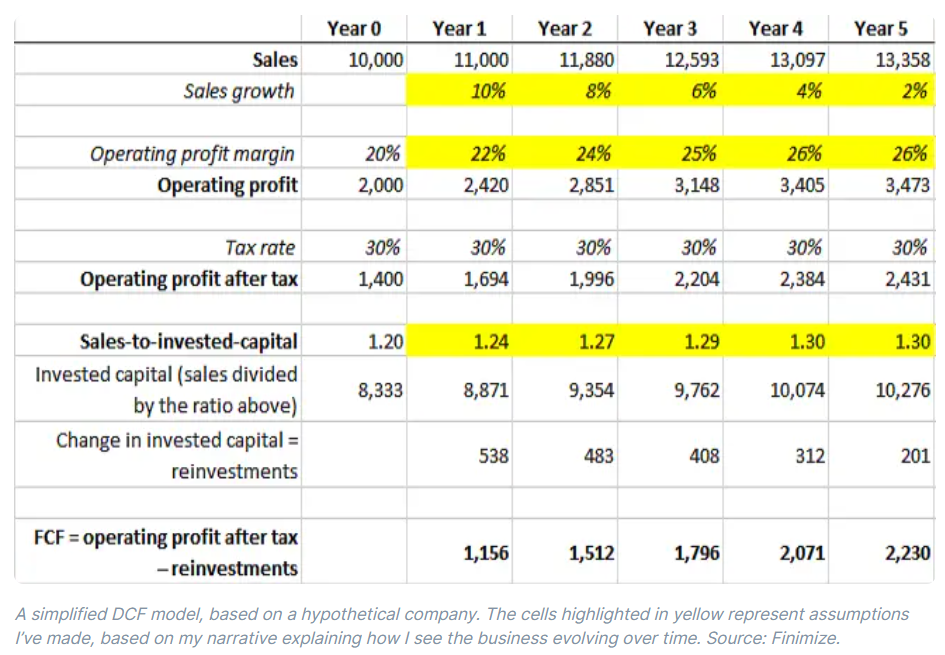
With this simple model, you can forecast a company’s future free cash flows (FCFs) using three of the four value drivers (revenue growth, profit margin, and investment efficiency). The fourth (riskiness) is captured when you discount the forecasted future FCFs by the company’s cost of capital, where the higher the company’s risk, the higher the cost of capital used.
Lastly, don’t forget to calculate the company’s terminal value: that’s the value of the company at the end of the forecast period (year five in our example), which basically captures all its future FCFs beyond that point. The formula below shows how to calculate the terminal value:
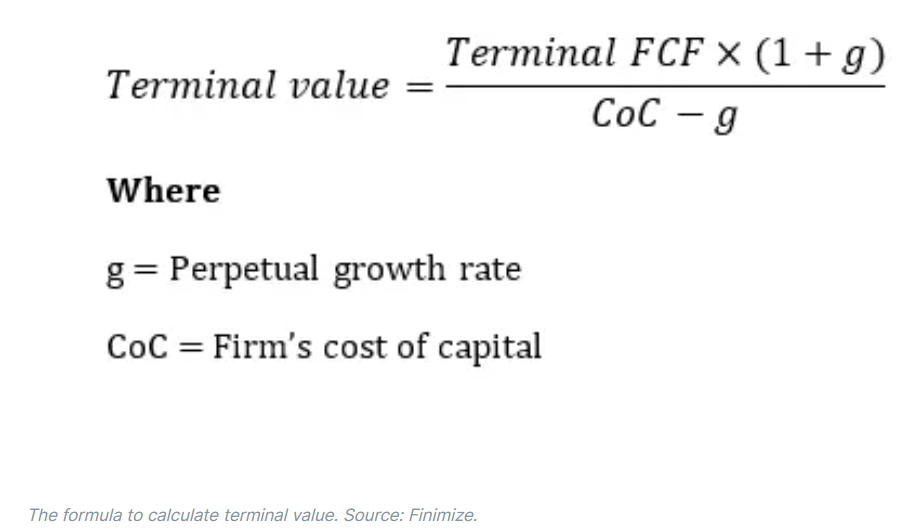
Note that you can capture the company’s risk of failure by simply changing the cost of capital used when calculating terminal value, where the higher the risk of failure, the higher the cost of capital. This would lower the company’s terminal value to reflect its higher risk of failure.
Once you’ve done all of the above, add the discounted value of each future cash flow to the company’s discounted terminal value. That’ll give you the total value of the entire company. To arrive at equity value per share, simply subtract net debt (that’s debt minus cash) from the total firm value and divide the result by the total number of shares outstanding.
Lesson 3: Capture a narrative in your model.
A good valuation isn’t just based on numbers: it also has a story. When you’re trying to value a business, work out how you see the business evolving over time, and then ask yourself whether it’s possible, plausible, and probable. There are lots of possible narratives, but not all of them are plausible, and only a few are probable.
Then you’ll want to convert the narrative into drivers of value. So take the narrative apart and look at how you can apply it to arrive at valuation inputs using the four drivers discussed above. By the time you’re done, each part of the narrative should have a place in your numbers, and each number should be backed up by a portion of your story. That will allow you to create a valuation model that captures the narrative, much like the simple DCF one shown earlier.
Here’s a great (albeit outdated) example using Uber from Damodaran himself:
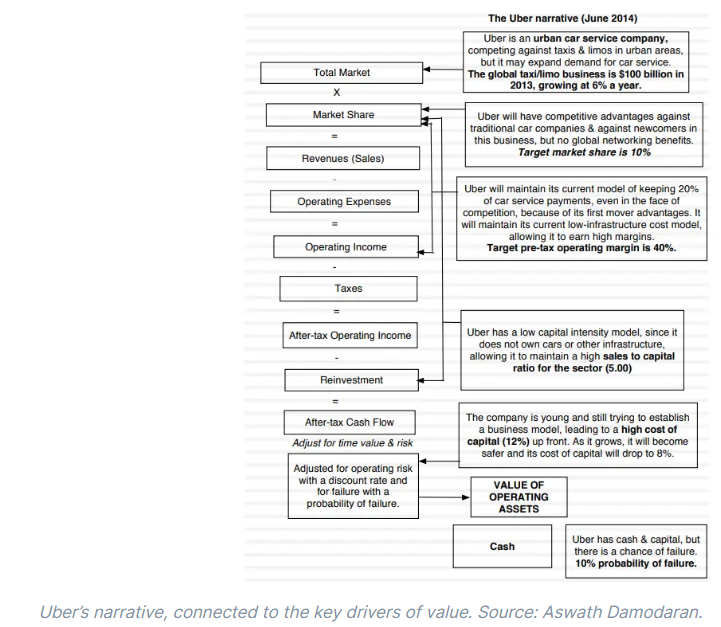
And remember to continually fine-tune – or, when necessary, overhaul – your narrative. Keep yourself up-to-date about the company’s news, and pay attention to experts who know the business better than you do or who have a completely different opinion from yours. They could inform your thinking. Damodaran often makes the point that Tesla “bulls” could learn a lot from talking to Tesla “bears”, and vice versa.
At the end of the day, you’re in the investing game to make money, not to prove you got everything right the first time…
Reda Farran is an analyst at finimize.
ii and finimize are both part of abrdn.
finimize is a newsletter, app and community providing investing insights for individual investors.
abrdn is a global investment company that helps customers plan, save and invest for their future.
These articles are provided for information purposes only. Occasionally, an opinion about whether to buy or sell a specific investment may be provided by third parties. The content is not intended to be a personal recommendation to buy or sell any financial instrument or product, or to adopt any investment strategy as it is not provided based on an assessment of your investing knowledge and experience, your financial situation or your investment objectives. The value of your investments, and the income derived from them, may go down as well as up. You may not get back all the money that you invest. The investments referred to in this article may not be suitable for all investors, and if in doubt, an investor should seek advice from a qualified investment adviser.
Full performance can be found on the company or index summary page on the interactive investor website. Simply click on the company's or index name highlighted in the article.