US forecast deep dive: smooth descent to get bumpier
Accelerating activity growth means a US recession is not imminent. But we still think a downturn is coming during our forecast horizon, even if recent activity and inflation dynamics make this an extremely close call.
19th September 2023 14:45
by abrdn Research Institute from Aberdeen

Key Takeaways
The US economy has been remarkably resilient in the face of high interest rates, which alongside a rapid drop in inflation, has raised hopes for a soft landing.
Certainly, some of the imbalances driving inflation have eased in a benign manner, without the need for slower growth.
Moreover, the rebound in interest sensitive activity alongside easing financial conditions could suggest the worst of the policy headwinds have passed.
However, underlying inflation is still too hot, and likely requires a deeper labour market adjustment to be brought sustainably back to target.
We think this shock is coming as the strong balance sheets that have so far insulated households and businesses from high interest rates start to crack.
We think this shock is coming as the strong balance sheets that have so far insulated households and businesses from high interest rates start to crack.
Slower spending will add to the drag on corporate profits and margins, alongside building interest costs, triggering a retrenchment in capex and hiring.
The contours of the downturn we are forecasting have changed. We now expect the recession to come later (mid-2024) and to be milder than previously feared.
These judgements are very close calls. A soft landing remains our second most likely scenario, and we have increased the probability we assign to it. Indeed, we continue to emphasise that a scenario-based approach to forecasting is most useful when comparing our views to market pricing.
Markets increasingly pricing a soft landing
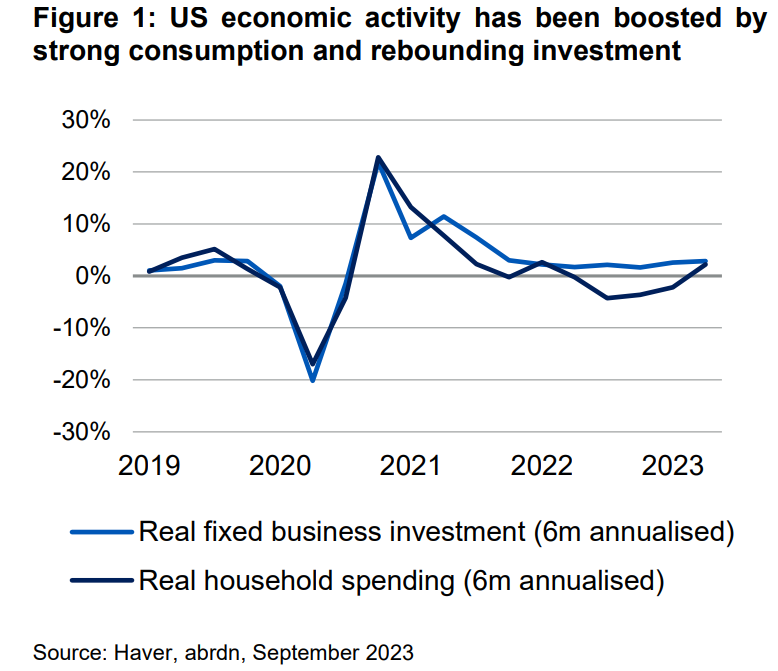
US economic growth has been remarkably resilient in the face of monetary policy tightening. Consumer spending is robust and there has been a rebound in investment, particularly residential and equipment capex (see Figure 1).
Solid growth has been accompanied by a benign loosening in the labour market, slowing wage growth and moderating inflation. Headline CPI is down in y/y terms from 9.1% in mid-2022 to 3.2% in July.
Moreover, the run rate of underlying inflation measures over shorter-term horizons is even more subdued. The three-month annualised increase in core CPI inflation is 3%, and the closely watched core services excluding shelter measure is down to just 1.7%. This has boosted hopes that inflation can return to target without needing a slowdown or recession.
In response to these encouraging signs, markets have priced in a much higher probability of a soft landing. Risk assets are up significantly this year (albeit heavily influenced by soaring tech stocks) and policy rates are now expected to drift slowly lower rather than falling rapidly as part of a substantial easing cycle.
An immaculate disinflation?
The apparently pain-free progress made on inflation this year has been helped by an improving supply side. Faster population growth and rising labour force participation has helped ease labour market pressure by increasing the number of available workers. A rise in productivity growth has softened labour cost pressures for firms. And the post-pandemic difficulties firms were experiencing in matching workers to openings seem to have eased.
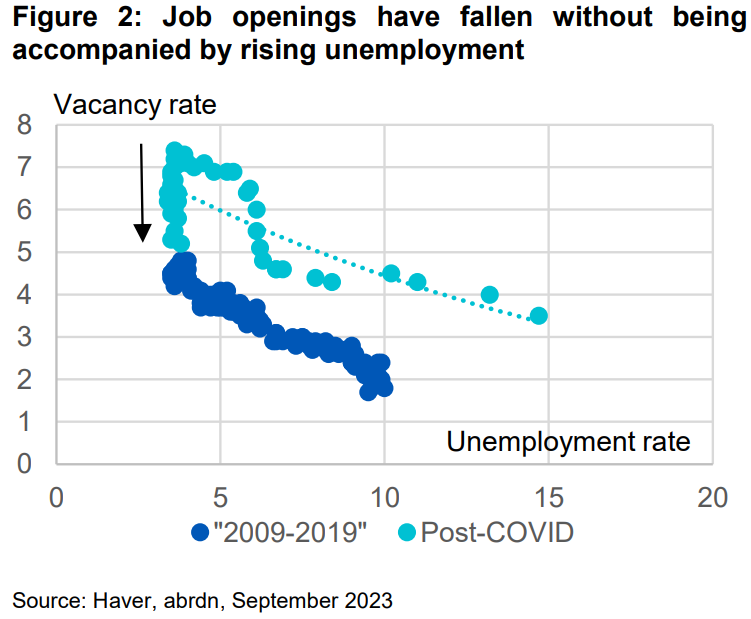
This has enabled the labour market to cool via a relatively painless fall in vacancies, as opposed to a much more painful rise in unemployment. Put another way, the Beveridge curve has shifted vertically downwards (see Figure 2, black arrow).
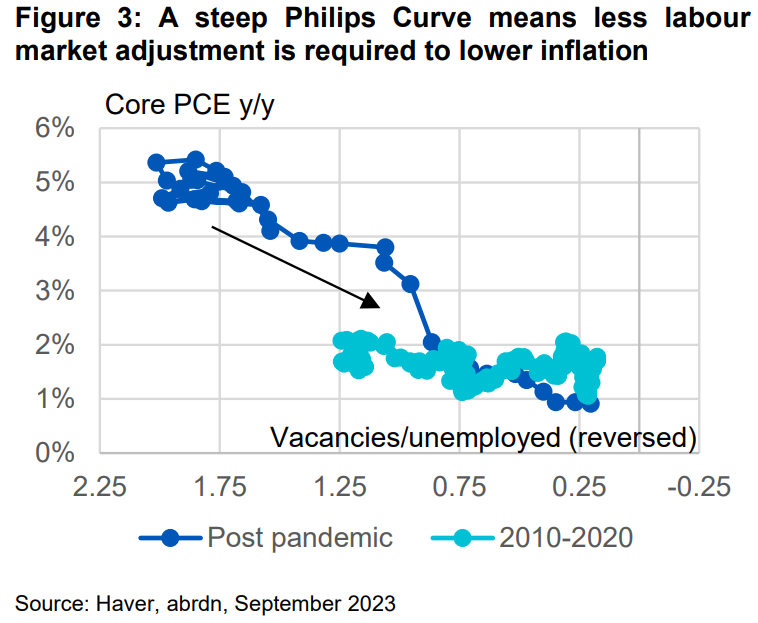
Moreover, the slack created by falling vacancies (both in absolute terms and relative to the unemployment rate) has translated into a proportionately large fall in inflation. In other words, the Phillips curve has been very steep, and so the sacrifice ratio is low (see Figure 3, black arrow).
Extrapolating these trends forward, perhaps only a very modest slowdown in activity growth would be required to squeeze the remaining excess inflation pressures out of the economy. Put another way, recent inflation developments seem to weaken the argument that a recession is necessary to sustainably return inflation to target.
Living with high interest rates
Meanwhile, the strength of activity data seems to have weakened the argument that the cumulative impact of past monetary tightening is sufficient to tip the economy into a recession.
After a period of significant weakness last year, interest rate sensitive sectors of the economy such as residential housing and equipment investment have recently stabilised. This suggests that the peak headwind from higher interest rates might already be behind us. Easing financial conditions might also imply that the negative impulse from monetary tightening has come and gone.
Moreover, strong private sector balance sheets continue to support the economy. Household debt burdens are at 20- year lows and much of this is tied up in 30-year fixed rate mortgages. Households have also been able to draw on savings stockpiles accrued during the pandemic.
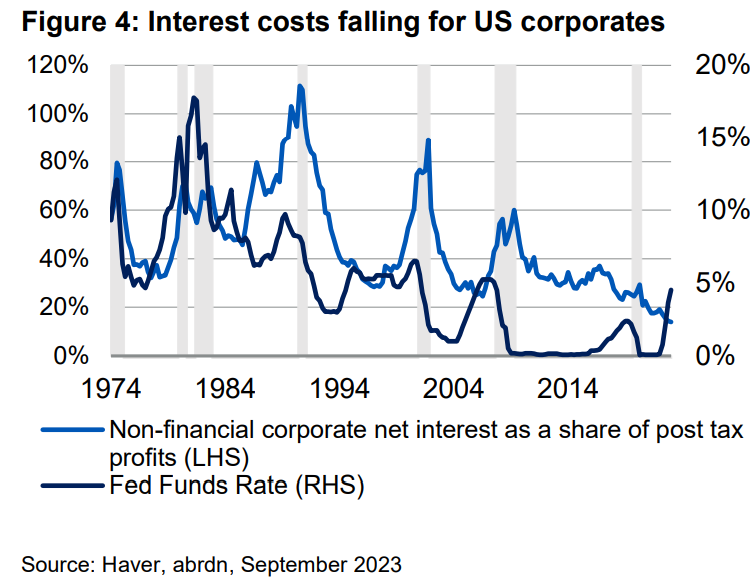
Corporates are carrying high debt loads from a historical standpoint, but the effect of higher interest rates has yet to bite. Net interest expenses as a share of post-tax profits have fallen, with corporates having successfully termed out their debt at low interest rates post-pandemic (see Figure 4). As a result, corporate margins and profits remain at healthy levels, even if down from their peak, providing firepower to hire and invest.
Taking these developments on inflation and activity together, there is no doubt the runway for a soft landing has widened. However, our judgement remains that a recession is still just about more likely than not.
Still work to do on inflation
We are not yet convinced that there is much scope for further pain-free disinflation for several reasons.
First, the apparent progress on reducing reported inflation probably flatters the true improvement in underlying inflation.
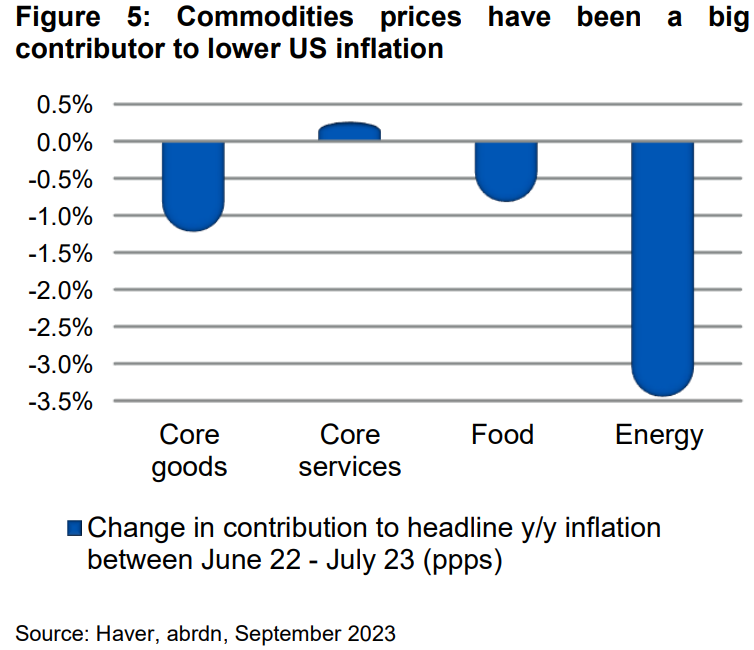
Falling global commodity prices and recovering supply chains have accounted for much of the downdrift in inflation over the past 12 months (see Figure 5). These effects are likely to be much smaller contributors going forward, and it is plausible energy price dynamics could start to push in the opposite direction in time.
Moreover, methodological quirks account for some of the reported decline in standard measures of inflation. In particular, plummeting reported health insurance prices reflect pandemic distortions given the way the BLS account for these prices when calculating CPI. This effect says little about underlying inflation and will wash out in time.
Excluding healthcare costs from the core services excluding shelter CPI measure sees the three-month run rate accelerate from 1.7% to a less healthy looking 3%.
Additionally, some volatile components of the inflation basket have delivered outsized contributions to the slowdown in inflation. For example, air fares have fallen 8% m/m over the past two months, generating meaningful 0.2% drags on the m/m run rate of core services CPI.
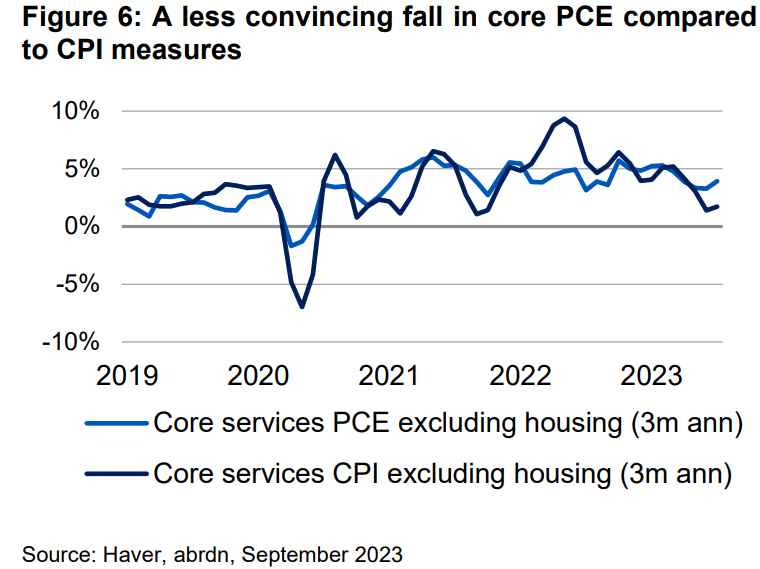
Indeed, core services PCE excluding housing, the Fed’s preferred gauge of underlying inflation pressures, has decelerated by less than the CPI equivalent (see Figure 6).
Second, we think wages need to fall a fair bit further to return to an inflation target consistent rate. For example, the Atlanta Fed wage tracking index, which is our preferred measure of pay growth, shows wages growing two percentage points faster than pre-pandemic rates.
This means that the labour market needs to cool further. With prime participation already at a 20 year high, there is limited scope for this to occur via an increase in labour supply.
Weaker labour demand has so far shown up in falling vacancies, but once again there seems to be limited scope for this dynamic to extend much further with vacancies having largely returned to the pre-pandemic level. With the labour market matching function repaired, further falls in vacancies may also be accompanied by rising unemployment.
Finally, the benefits of a steep Phillips curve may now be exhausted. Historical Philips curves look flatter at this level of labour demand, suggesting the economy may now move to a part of the curve with a higher sacrifice ratio.
Policy headwinds to build into 2024
Furthermore, while the economy has been resilient to higher rates in 2023, we think the drag from policy tightening will build.
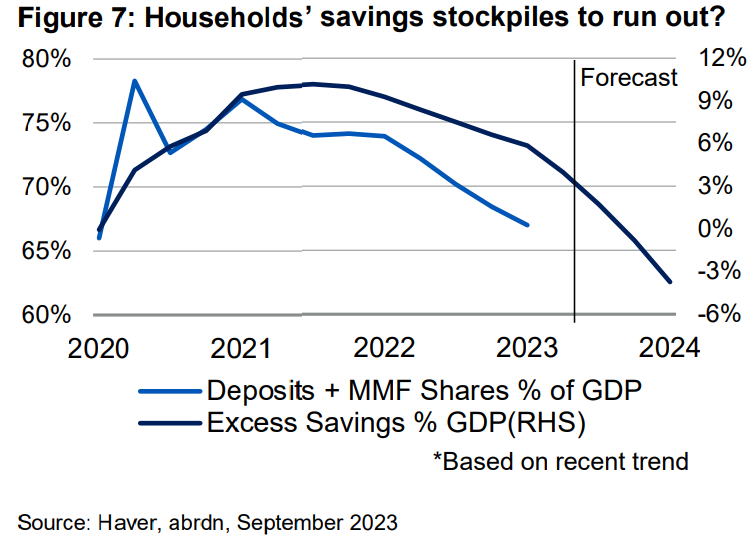
On the household side, our analysis suggest that savings buffers peaked at around 10% of GDP but have since fallen to 4% and could be exhausted by the end of the year (see Figure 7). Against the backdrop of tight credit conditions, this run-down of excess savings should provide more of a drag on spending.
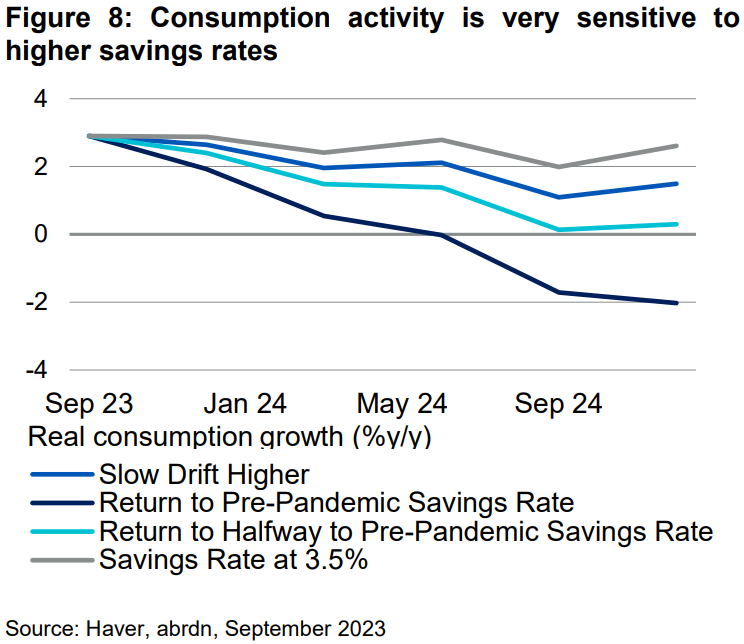
Consumption activity is extremely sensitive to shrinking savings and an increase in saving rates. Even a modest drift higher in savings rates over coming months would roughly halve the rate of spending growth by the end of the year (see Figure 8). This would still leave savings rates much lower than pre pandemic trends (2015-19). If they were to recoup even half this gap then spending would stall. And if they returned to the pre-pandemic rate, this would cause a sharp fall in consumption.
The resumption of student loan repayments will also exert a drag on activity of up to 0.4-0.5pps off consumer spending over the next year.
Interest payments for businesses will rise as debt matures and is rolled onto higher rates, weighing on margins. The high yield market will need to start refinancing $120bn of maturing 2025 debt next year, which will all be done at much higher interest rates. Smaller firms unable to tap credit markets will feel these strains even more acutely. Margins will also suffer if household consumption slows over coming months, eroding pricing power amid still high input costs.
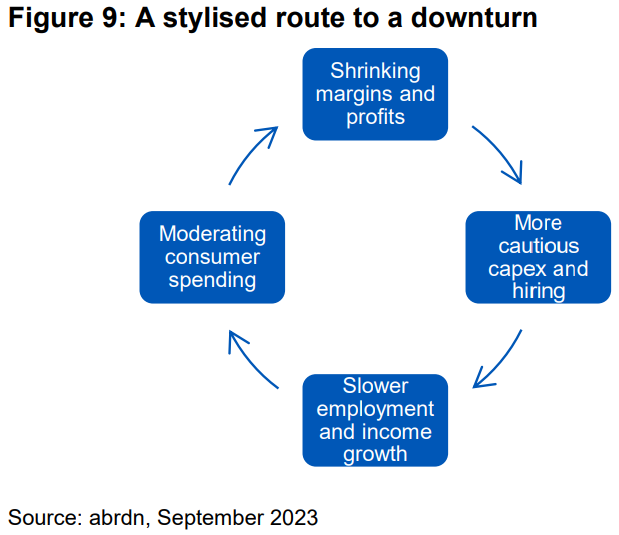
As such, we expect the recent dip in corporate profits to turn into a deeper slump. Declining profits would undermine the firepower for capex and hiring, especially in an environment of tight credit conditions, and make businesses more conservative, causing an adverse feedback loop to develop (see Figure 9).
No pain, no (further) gain
Bringing this together, we now expect a US downturn to start in mid-2024, around 6 months later than previously anticipated. This is consistent with the signals from our recession probability models, which have also fallen in the near term but remain high on 9-24 month horizons.
Moreover, we expect this recession to be milder, reflecting the progress made on addressing supply/demand imbalances this year. More resilient growth in the near term makes one more 25bps Fed rate hike more likely, perhaps at the November FOMC meeting. Should growth remain robust into 2024 there is a risk of further tightening.
However, it is clear that the path to a soft landing has widened. It is certainly possible that we continue to underestimate the economy’s ability to withstand high interest rates and overestimate the difficulty of lowering inflation.
Indeed, this is now an extremely finely balanced judgement, and our scenario analysis shows a very small gap between our base case and a soft landing scenario. The weighted average across our scenarios should be used when comparing our views to those embedded in market pricing, where the gap is much smaller than it is with our base case alone.
Written by James McCann, Deputy Chief Economist at abrdn.
ii is an abrdn business.
abrdn is a global investment company that helps customers plan, save and invest for their future.
These articles are provided for information purposes only. Occasionally, an opinion about whether to buy or sell a specific investment may be provided by third parties. The content is not intended to be a personal recommendation to buy or sell any financial instrument or product, or to adopt any investment strategy as it is not provided based on an assessment of your investing knowledge and experience, your financial situation or your investment objectives. The value of your investments, and the income derived from them, may go down as well as up. You may not get back all the money that you invest. The investments referred to in this article may not be suitable for all investors, and if in doubt, an investor should seek advice from a qualified investment adviser.
Full performance can be found on the company or index summary page on the interactive investor website. Simply click on the company's or index name highlighted in the article.