Trusts and their mirror funds: who is the fairest?
A Kepler analyst compares the performance of global-focused investment trusts and open-ended funds during the most recent tech-driven rally, and beyond.
15th November 2024 14:43

This content is provided by Kepler Trust Intelligence, an investment trust focused website for private and professional investors. Kepler Trust Intelligence is a third-party supplier and not part of interactive investor. It is provided for information only and does not constitute a personal recommendation.
Material produced by Kepler Trust Intelligence should be considered a marketing communication, and is not independent research.
Many investment trusts have an open-ended equivalent and, from time to time, we are asked whether there is an inherent advantage to the former when it comes to performance.
Arguably, a comparison of the two structures by a research team focused on investment trusts carries some risk of confirmation bias, but with our most ardent promise of a fair hearing, in this study we give it a go - analysing the performance of funds and trusts with global exposure during the most recent, tech-driven rally, further back too…
- Invest with ii: Buy Investment Trusts | Top UK Shares | Open a Trading Account
Weighing in the contestants
In the interest of fairness, let’s start by acknowledging some merits of the OEIC structure. We think it’s safe to say that the open-ended structure is generally simpler to understand, as there is no premium/discount mechanism and no gearing involved, and the lack of gearing means there can be less downside risk. Investment trusts aren’t always the most liquid equities, so spreads can widen in down markets too, whereas with open-ended funds you only need to worry about the spread on the equities in the portfolio.
Having fulfilled our duty of courtesy, let’s turn to the advantages of investment trusts. First, the permanency of capital means managers do not have to worry about inflows and outflows, which helps preserve their strategy, avoid cash drag and pursue opportunities in less liquid assets. While gearing and the premium/discount mechanism add complexity, they can also enhance performance. Thanks to these unique features, investment trusts are theoretically better positioned to outperform open-ended funds in rising markets – and therefore, over the long term.
Round one
However, we know that theory and practice don’t always align. As a result, we examined performance data to see whether the theory holds up. For our analysis, we chose the AIC Global, Global Equity Income, North America, and Technology & Technology Innovation sectors, along with their open-ended equivalents. We appreciate that the AIC universe is broader than this, and we may look at other sectors in the future, but we selected these specific sectors this time around because they were recently (or had the potential to be) exposed to a rising market, spurred by the AI rally. We chose the launch of Chat GPT (30/11/2022) as a starting point for measuring performance. We also reviewed performance over five years (to 01/11/2024) to assess longer-term returns. We defined an open-ended sibling as any fund that has shared at least one manager with its investment trust counterpart for a minimum of five years, broadly follows the same investment goals, and falls within an equivalent Investment Association sector. The table below lists the investment trusts for which we could identify open-ended counterparts, indicating whether their cumulative fair NAV performance has outmatched the total returns (TR) generated by their open-ended sibling since ChatGPT’s launch and over the five-year period ending 01/11/2024.
PERFORMANCE FROM 30/11/2022 TO 01/11/2024 AND OVER FIVE YEARS (to 01/11/2024)
| Investment trust | Equivalent open-ended fund | Investment trust cumulative fair NAV performance during AI rally (%) | Open-ended fund TR during AI rally (%) | Outperformance of IT | Investment trust NAV performance over five years (%) | Open-ended fund TR performance over five years (%) | Outperformance of IT (percentage points) |
| JPMorgan Global Growth & Income Ord (LSE:JGGI) | JPM Global Equity Income | 35.9 | 18.4 | 17.5 | 106.4 | 75.7 | 30.7 |
| Monks Ord (LSE:MNKS) | Baillie Gifford Global Alpha Growth | 25.8 | 22.7 | 3.1 | 56.1 | 51.4 | 4.7 |
| Martin Currie Global Portfolio Ord (LSE:MNP) | FTF Martin Currie Global Uncons | 22.3 | 20.1 | 2.2 | 35.5 | 15.5 | 20 |
| Polar Capital Technology Ord (LSE:PCT) | Polar Capital Global Tech | 70.7 | 68.7 | 2 | 135.8 | 117.3 | 18.5 |
| Scottish American Ord (LSE:SAIN) | Baillie Gifford Global Inc Growth | 16.3 | 16.9 | -0.6 | 61.5 | 57.7 | 3.8 |
| Henderson International Income Ord (LSE:HINT) | Janus Henderson Global Eq Income | 8.8 | 13.6 | -4.8 | 37.8 | 40.1 | -2.3 |
| Baillie Gifford US Growth Ord (LSE:USA) | Baillie Gifford American | 32.1 | 52.3 | -20.2 | 86.8 | 85 | 1.8 |
Source: Morningstar, AIC, Kepler estimations. Past performance is not a reliable indicator of future results
Based on our sample of seven pairs, investment trusts seem to produce better returns than open-ended funds over the long term and in rising markets, with 57% of investment trusts having outperformed their open-ended version over the AI rally and 71% over five years.
Round two
However, we did not include share price TR performance in our table, as it is a function of demand and supply for shares of an investment trust and does not reflect NAV performance. Share price TR performance is what investors ultimately receive, but can diverge from NAV performance significantly at times. In each period measured, only 29% of the trusts in our list have delivered both cumulative fair NAV and share price TR in excess of their open-ended version’s total returns.
This weak share price performance reflects the fact that discounts have widened, particularly since 2022. Higher interest rates have made fixed-income instruments or simply holding cash more attractive than risk assets, which likely impacted demand for investment trusts’ shares. Concerns about a potential global recession have also likely played a role, as investors are often tempted to seek refuge in safe-haven assets such as sovereign bonds and gold in those circumstances, as we discuss here. Furthermore, investment trusts have faced regulatory challenges around cost disclosures, which we address here. We note that even those trusts that have performed very well over the past year still trade on wide discounts at the moment. In our view, this reflects opportunity: discounts should close to NAV over time, even if it takes corporate activity.
The champions
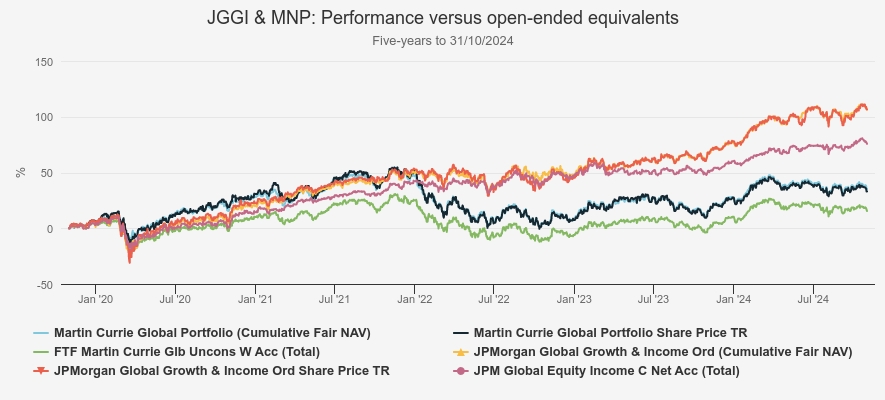
Notwithstanding the general picture of widening discounts, two trusts stand out as having outperformed their open-ended peers in both share price and NAV terms: JPMorgan Global Growth & Income Ord (LSE:JGGI)and Martin Currie Global Portfolio Ord (LSE:MNP). The chart below illustrates the cumulative fair NAV and share price performance of these two trusts, alongside the total returns generated by their open-ended equivalents over five years.
FIVE-YEAR PERFORMANCE

Source: Morningstar. Past performance is not a reliable indicator of future results
JGGI shares a global equity income mandate, an additional goal of providing capital growth and a manager, Helge Skibeli, with JPM Global Equity Income. The trust has been a successful consolidator, absorbing three other investment trusts since the start of calendar year 2022: Scottish Investment Trust (SCIN), JPMorgan Elect (JPE) and JPMorgan Multi-Asset Trust (MATE). As a result, JGGI has gained scale, increasing its assets under management (AUM) to £2.8 billion (as of 30/09/2024), making it more attractive to a larger pool of investors. This increased size, along with good performance and the growth and income offering, have helped push the trust to a 1.2% premium at the time of writing, meaning the trust is able to issue new shares into the market and grow even further. This can only lower the ongoing charges figure (OCF), which is already significantly lower than the open-ended equivalent, at 0.48% versus 0.90% for JPM Global Equity Income.
JGGI funds its dividend from both capital and income, a feature not available to open-ended funds, but giving investment trusts more versatility. This means the trust is able to invest in growth-oriented sectors and stocks, which are traditionally not associated with income strategies. As of 05/11/2024, Morningstar data shows JGGI with 35.5% of its portfolio invested in growth stocks, compared to 17.9% for JPM Global Equity Income. Morningstar classifies stocks as growth or value using a combination of forward- and backward-looking measures, including historical earnings and sales growth for growth stocks, and price-to-book and price-to-sales ratios for value stocks. JGGI also offers a higher yield than its open-ended counterpart. At the time of writing, the trust has a historic yield of 4.1%, while JPM Global Equity Income’s latest factsheet (dated 30/09/2024) reports a yield of c. 2.2%.
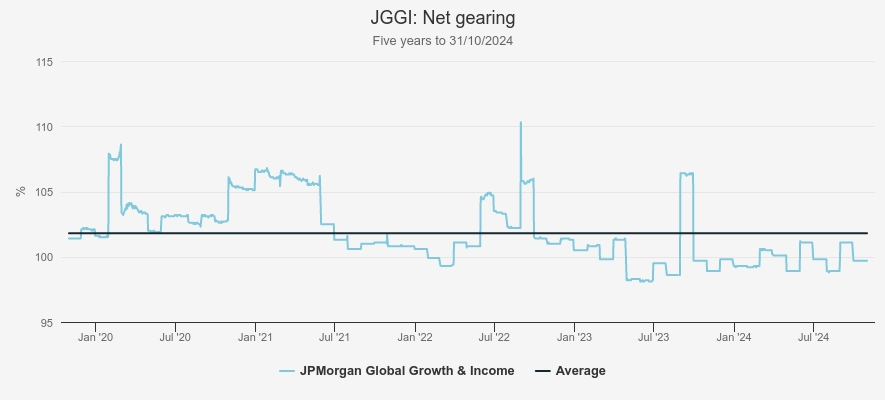
JGGI’s gearing has also contributed to good performance in a rising market. While JGGI has used gearing moderately, as indicated by an average net gearing of approximately 1.8% over the five years to 31/10/2024, it has been employed tactically, based on key macroeconomic indicators and valuation expectations, as shown in the chart below.
NET GEARING

Source: Morningstar.
MNP has achieved a similar feat, with its NAV and share price total returns outperforming FTF Martin Currie Global Unconstrained Fund over five years and over the AI rally. Both strategies, managed by Zehrid Osmani, follow a high-conviction approach, each holding only 31 stocks (as of 30/09/2024) that the manager believes can benefit from megatrends shaping the global economy, such as AI, energy transition and an ageing population.
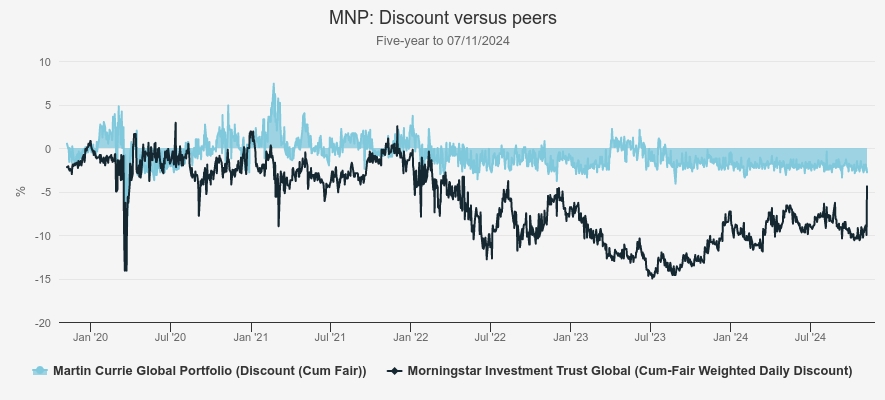
The board of MNP operates a zero-discount policy, meaning that it aims to keep the trust’s shares to trade as close to NAV as possible, and this is achieved through share repurchases. This policy seems to have borne fruit, as the chart below shows, with MNP having traded at an average discount of 0.8% over five years (to 07/11/2024). As a result, MNP’s share price TR performance has closely tracked the trust’s cumulative fair NAV performance.
FIVE-YEAR DISCOUNT

Source: Morningstar
Therefore, we think it makes sense to look at what has driven MNP’s cumulative fair NAV outperformance relative to the total return generated by FTF Martin Currie Global Unconstrained Fund. In our view, gearing may have played a significant role, with an average gearing of 6.2% over the five years to 31/10/2024. Zehrid believes that structural gearing can enhance long-term returns for shareholders, although it may also increase potential losses in down markets, as seen in 2022.
We also think that the stability of capital provided by the investment trust structure may have enabled Zehrid’s strategy to come into its own, delivering better results than the open-ended version. Finally, we note that MNP has a lower OCF than FTF Martin Currie Global Unconstrained Fund, at 0.64% versus 0.86%.
The judges’ scores
We think we have shown that the strong performance of global-focused trusts over the AI rally has been helped by the unique features of the structure, such as permanency of capital, gearing or the flexibility investment trusts have to pay dividends.
However, strong NAV performance has not always been accompanied by strong share price performance. We think, though, that looking forward, this implies opportunity. An investment trust trading at a discount offers an additional source of potential alpha to any open-ended fund, although of course it may take some time for a discount to close.
A worked example makes it clear how these advantages can compound. Let’s imagine an investment trust is trading today on a 10% discount, has a 5% gearing and goes on to return 7% per annum over the following five years. Without gearing, the NAV return (and the return on an open-ended fund with an identical portfolio and fees) would be c. 40%, which would rise to c. 42% with gearing. Then, if we assume that the trust’s discount completely closes over this period, we get a share price return of c. 57% (this is what goes into your pocket).
Ultimately, both investment trusts and open-ended funds have their pros and cons, and it’s up to investors to decide what structure they feel more comfortable with. Investment trusts do have extra risks to be aware of, but we think they are outweighed by the advantages for long-term investors.
Kepler Partners is a third-party supplier and not part of interactive investor. Neither Kepler Partners or interactive investor will be responsible for any losses that may be incurred as a result of a trading idea.
These articles are provided for information purposes only. Occasionally, an opinion about whether to buy or sell a specific investment may be provided by third parties. The content is not intended to be a personal recommendation to buy or sell any financial instrument or product, or to adopt any investment strategy as it is not provided based on an assessment of your investing knowledge and experience, your financial situation or your investment objectives. The value of your investments, and the income derived from them, may go down as well as up. You may not get back all the money that you invest. The investments referred to in this article may not be suitable for all investors, and if in doubt, an investor should seek advice from a qualified investment adviser.
Full performance can be found on the company or index summary page on the interactive investor website. Simply click on the company's or index name highlighted in the article.
Important Information
Kepler Partners is not authorised to make recommendations to Retail Clients. This report is based on factual information only, and is solely for information purposes only and any views contained in it must not be construed as investment or tax advice or a recommendation to buy, sell or take any action in relation to any investment.
This report has been issued by Kepler Partners LLP solely for information purposes only and the views contained in it must not be construed as investment or tax advice or a recommendation to buy, sell or take any action in relation to any investment. If you are unclear about any of the information on this website or its suitability for you, please contact your financial or tax adviser, or an independent financial or tax adviser before making any investment or financial decisions.
The information provided on this website is not intended for distribution to, or use by, any person or entity in any jurisdiction or country where such distribution or use would be contrary to law or regulation or which would subject Kepler Partners LLP to any registration requirement within such jurisdiction or country. Persons who access this information are required to inform themselves and to comply with any such restrictions. In particular, this website is exclusively for non-US Persons. The information in this website is not for distribution to and does not constitute an offer to sell or the solicitation of any offer to buy any securities in the United States of America to or for the benefit of US Persons.
This is a marketing document, should be considered non-independent research and is subject to the rules in COBS 12.3 relating to such research. It has not been prepared in accordance with legal requirements designed to promote the independence of investment research.
No representation or warranty, express or implied, is given by any person as to the accuracy or completeness of the information and no responsibility or liability is accepted for the accuracy or sufficiency of any of the information, for any errors, omissions or misstatements, negligent or otherwise. Any views and opinions, whilst given in good faith, are subject to change without notice.
This is not an official confirmation of terms and is not to be taken as advice to take any action in relation to any investment mentioned herein. Any prices or quotations contained herein are indicative only.
Kepler Partners LLP (including its partners, employees and representatives) or a connected person may have positions in or options on the securities detailed in this report, and may buy, sell or offer to purchase or sell such securities from time to time, but will at all times be subject to restrictions imposed by the firm's internal rules. A copy of the firm's conflict of interest policy is available on request.
Past performance is not necessarily a guide to the future. The value of investments can fall as well as rise and you may get back less than you invested when you decide to sell your investments. It is strongly recommended that Independent financial advice should be taken before entering into any financial transaction.
PLEASE SEE ALSO OUR TERMS AND CONDITIONS
Kepler Partners LLP is a limited liability partnership registered in England and Wales at 9/10 Savile Row, London W1S 3PF with registered number OC334771.
Kepler Partners LLP is authorised and regulated by the Financial Conduct Authority.