A trio of investment trust alternatives to multi-asset funds
17th January 2019 16:28
This content is provided by Kepler Trust Intelligence, an investment trust focused website for private and professional investors. Kepler Trust Intelligence is a third-party supplier and not part of interactive investor. It is provided for information only and does not constitute a personal recommendation.
Material produced by Kepler Trust Intelligence should be considered a marketing communication, and is not independent research.
The closed-ended space offers a number of interesting investment funds entirely uncorrelated to equity markets, many of which may have flown under the radar.

We analyse why multi-asset macro funds have struggled and attempt to identify some possible closed-ended alternatives...
There may be trouble ahead
Thomas McMahon, senior analyst at Kepler Trust Intelligence
Investors returned to real life with a bump this month. As markets re-opened for the new year, shares tumbled around the world on renewed fears over the US-China trade wars among several other factors. The market sell-off - which began in October - shows little sign of abating.
It is understandable then that investors are increasingly looking for ways to protect portfolios. The large multi-asset macro absolute return funds, which many have been relying on for support in these sorts of circumstances, have largely been a disappointment which only increases the urgency of the search. In our view, there are a number of interesting options in the closed-ended space that may have flown under the radar. We take a look under the bonnet to try to discover why multi-asset macro funds have struggled and attempt to identify some possible closed-ended alternatives.
Equity markets in a tailspin
The latest market sell-off began on the second of October 2018. Although concerns about the impact of trade wars have weighed on some markets all year, the sell-off in October was classic late cycle stuff: sparked by concerns around valuation and slowing economic growth.
Many commentators and investors have even become concerned that the US federal reserve is tightening monetary policy too quickly, which could weaken economic activity. Whether this is true or not, rising discount rates have caused a reset of valuations, and global economic growth is unarguably slowing.
In the US, growth is slowing as a spike due to tax cuts expires, while growth in the UK and Europe is under 1.5% a year. A continuation of trade wars can only reduce growth further. There is no obvious reason why investors can expect a rebound in markets.
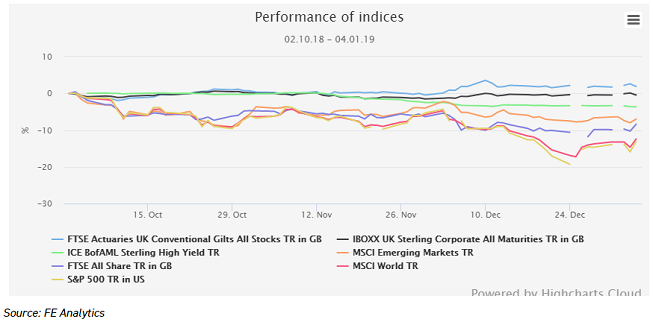
Reflecting these pressures, the S&P 500 is down over 10% in sterling terms since October, and the UK a little over 8%. The trade-sensitive Japanese market has suffered even more, while European markets have been under pressure as economic data on the continent has been weak and political flashpoints loom.
Emerging markets have actually done well compared to other markets since October, having suffered their steepest sell-offs earlier in the year. Credit markets have offered no diversification, with corporate and high yield indices all down in their local currencies.
Performance of Markets in Sell-off
If not equities – then where?
Gilts have traditionally been the "risk-off" trade for those nervous about equity markets. UK investors who have maintained an allocation to gilts since October 2018 have benefitted, with the index up 2% in the sell-off. Nevertheless, there are good reasons why the gilt market doesn’t seem to us like a sensible basket to put all one’s eggs in at the moment.
At 1.2%, the UK 10 year is 25bps lower than its pre-2016 referendum level. The duration on the gilts index is now 11.3 years, up from 8.3 in 2009, according to Bloomberg data, meaning the potential for losses from the index should UK rates rise is much higher than in the past. In our view, gilts are likely to rally should a no-deal Brexit lead to panic in UK markets, just as they did post June 2016. However, this is only one specific scenario and is only three months away.
In most scenarios, and over the medium term, gilts are likely to lose capital value, and especially those with index duration possibly inflicting severe losses.
Moreover, in the period since October, the gains in gilts came entirely in December. They were flat to negative during October and November, showing there is a real danger of investors suffering periods in which both UK equities and bonds sell off. Their traditional role as a shock-absorber is very much in question.
The popular alternatives
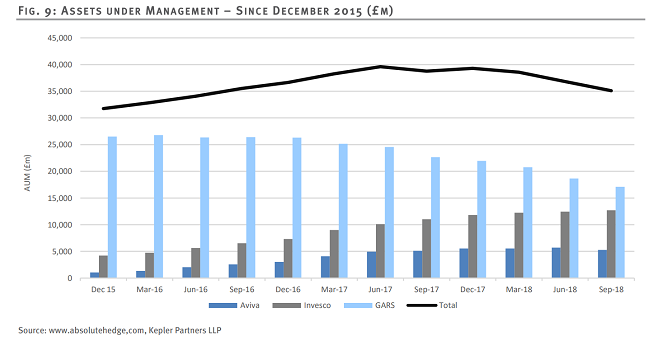
In recent years, and recognising that gilts are no-longer likely to be inversely correlated with equity markets, investors have sought protection from market volatility in the targeted absolute return sector. While there are a number of different types of strategy in that sector, in most cases this has meant investors turning to the global multi-asset macro funds run by Standard Life, Aviva Investors and Invesco (peak AuM across all three managers/strategies totalled c.£40bn).
After many years of impressive returns, these funds have more recently struggled to live up to their objectives. In a recent paper by our sister site Absolute Hedge, Matthew Barrett highlighted the degradation of returns in recent years. As the graph below shows, on a rolling three-year basis, returns are significantly below target and have been for some time.
In the case of GARS, returns have been negative for over a year. As such, the confidence that investors previously held in these funds has been dented (total outflows since peak AUM has been c£5bn, representing a 12.5% fall in assets). Together they currently represent £30bn of the £75bn invested in the TAR sector, according to IA figures.
Returns of Multi-Asset Giants
Source: Kepler Partners
Matthew highlights that the correlation between the three multi-asset macro funds has been only moderate, at between 0.5 and 0.6, so the failure has not been from sharing the same losing positions.
Many commentators note the significant size of these funds as limiting returns. This is superficially an attractive thesis given that all three funds have seen a deterioration of their returns since their early successes when they were much smaller in AuM terms. However, from the outset these funds have been designed to be inherently scalable.
It is true, however, that the liquidity of these funds has decreased as they have grown, but this would likely only be a significant problem should the funds see a significant run on their assets.
There is some hope for holders, however. Matthew's key insight is that the deterioration of returns may have been due to the poor nature of the QE-dominated macro environment for these types of funds, specifically the low volatility in recent years, which reduces the number of opportunities to make gains on trades and the size of the potential gains.
Low volatility has decidedly not been a problem in the latter half of 2018, however. And in fact, this raises the possibility that with volatility higher in markets, rates rising steadily in the US and the Fed running down its stock of treasuries, the environment may once again become more conducive to these funds’ strategies. We reproduce an extract from the report here:
"One characteristic we have noted is that the funds have been less volatile than perhaps would be expected. In an environment where volatility has been incredibly low this is a factor that has been common across many alternative strategies, but it does raise questions about how risk is managed and deployed.
Thinking about this another way, since the inception of GARS the annualised volatility of the MSCI World has been 13.9%, so half the volatility of this would have been 7%. The realised Sharpe of GARS over the same period has been 0.7, and if the fund had generated a volatility half that of global equities i.e. 7% (vs. 5.2% realised) then the same Sharpe of 0.7 would have seen an annualised return of 5.8%, which is significantly closer to target.
In our view there are two likely causes behind the reduction in headline volatility. The first and most obvious is that realised volatility across pretty much all asset classes has been exceptionally low in an environment of quantitative easing.
This has seen funds across all strategies struggling to get anywhere near target volatility. Secondly, and harder to pinpoint, is the potential that with all three of the funds sitting on significant AUM balances, the incentives for the management of the product changes; rather than reaching for returns it is better to adopt a 'don't mess it up' mentality."
Retail vs professional
We believe that, amongst a number of reasons, a major driver of investors making allocations to the multi-asset macro funds is as a counterbalance against equity volatility, a role traditionally performed by gilts. It is therefore no surprise that in a period in which equity markets have performed poorly, and at the same time there has been a poor performance from the benchmark funds, retail appetite for the TAR sector has dimmed.
According to IA figures, the sector has seen outflows every month since July. While appetite for all funds has dimmed in the sell-off, the picture has been particularly poor for this supposedly diversifying sector.
Fund Flow Data
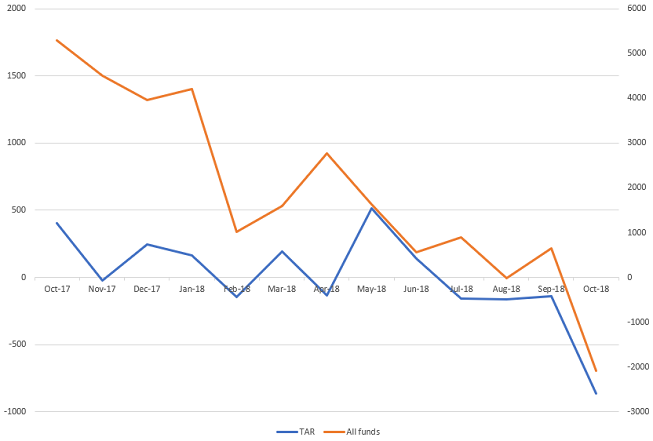
LH axis: TAR funds, RH axis: All funds
Source: Investment Association
The picture is somewhat different for institutional investors, however, who recognise the need for diversifying assets in their portfolios. According to Morgan Stanley data reported in the FT, fund managers are expecting to raise their allocations to a range of alternative asset classes over the coming year, including hedge funds, the most appropriate comparator for the TAR sector in our view.
This is likely a recognition of the fact that in a late cycle environment, returns from mainstream equities are likely to be harder to come by, as well as a desire to increase holdings in protective assets in a troubled market environment.
To follow the path of the professionals, we have looked at several diversifying asset classes. From the categories in the graph above, we have written extensively on the opportunities in listed private equity quite recently.
However, the closed-ended space offers a number of interesting investment funds entirely uncorrelated to equity markets, many of which may have flown under the radar.
BH Macro
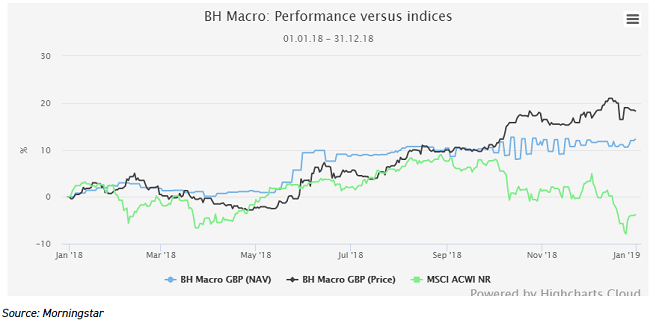
BH Macro (LSE:BHMG) had an outstanding 2018, with NAV up 12.4% in 2018 and the discount narrowing from 7% at the start of the year to just 1% in January 2019 (for the GBP share class). The NAV returns were a direct consequence of a return of volatility to markets, which the strategy of BH Macro has so far proven itself to be better suited to than that of GARS and co.
Performance in 2018
BH Macro (LSE:BHMG) is a feeder into the Brevan Howard Master Fund, a macro hedge fund. The Master Fund aims to generate capital growth through a combination of global macro and relative value trading strategies.
Rather than aiming to make a call on the direction of markets or the economy, Brevan Howard's traders look for trades with an asymmetric risk/reward payoff.
Ideally the potential downside is merely the cost of putting on the trade with the upside being substantial. It is feasible and likely that at any one time the trust will be exposed to payoffs which directly contradict, but this should be a win-win scenario if the risk calculations have been correctly made.
In 2018, BH Macro profited from the return of volatility to rates markets, specifically from the sell-off in Italian debt in March which made the trust 8% in a month. The managers stress that they made no call on whether this sell off would happen, but engineered a cheap trade with limited downside and huge upside if it played out.
Since inception in 2003, the Brevan Howard Master Fund has displayed a negative correlation to global equities, measured by the MSCI AC World, of -0.13. The correlation to the FTSE World Government Bond index has been a negligible 0.11.
BH Global
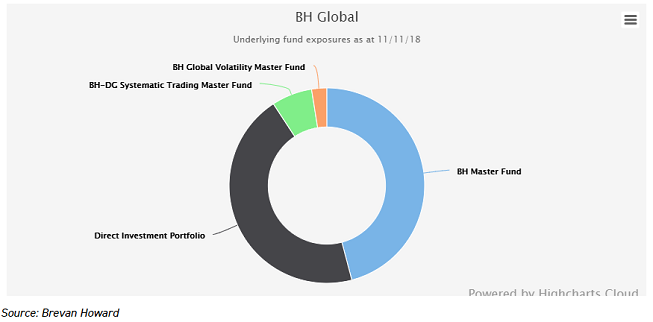
BH Global (LSE:BHGG) is a more diversified option than its sister BH Macro. The company offers access to the Brevan Howard Multi-Strategy Master Fund, which invests in the firm’s strategies in multiple asset classes, with the allocation decisions made by the Brevan Howard investment committee.
The Master Fund currently has around 45% invested in the Direct Investment Portfolio, which is essentially an allocation to the traders whose books make up BH Macro, so the correlation between the two trusts is relatively high. It is less than it was in 2017, however, when the allocation reached 60%.
Unlike on a global macro fund, the allocation between the strategies is not driven by a view on market directionality. Rather, the committee judges where they see the best opportunities for returns in terms of the volatility of the asset class and the nature of the trading book.
Underlying Fund Allocations
Like BH Macro, the basic approach is to look for trades with a much higher potential upside than downside and use leverage to increase their return potential. The diversified approach means that the trust has displayed lower volatility than its sister fund and it has produced positive returns in nine of the ten calendar years since launch.
The NAV was up 5.4% in 2018, during which conventional asset classes were all down, with the exception of safe haven bonds. The discount has also significantly narrowed, from 7% to 4% over the course of 2018 (GBP share class).
Ruffer Investment Company
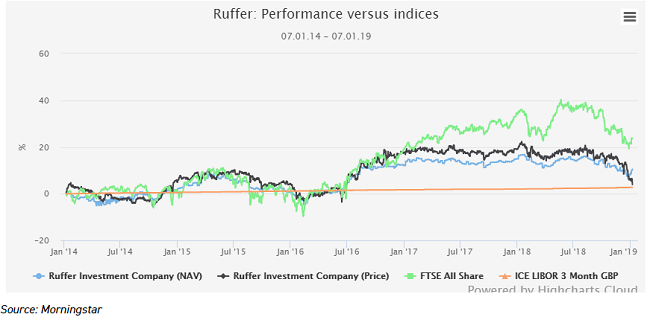
Ruffer (LSE:RICA) offers a more conventional multi-asset strategy, although it does make use of sophisticated investment techniques such as derivative contracts and short positions. Ruffer takes a cash-relative benchmark common to the absolute return and hedge fund sectors, aiming to beat cash without losing money over any 12-month rolling period.
The trust is, however, more committed to a single view of the world than the Brevan Howard funds, in much the same way that GARS and co are. In recent years that has mean being positioned for a return of inflation which has not yet transpired except for relatively short periods of time such as immediately following the election of Trump. Returns have therefore been disappointing, and the trust was down 8% in NAV terms in 2018.
Shareholders are protected from discount moves by a robust discount control mechanism, although the trust has slipped onto a 3.8% discount despite the buybacks.
Performance
Kepler Partners is a third-party supplier and not part of interactive investor. Neither Kepler Partners or interactive investor will be responsible for any losses that may be incurred as a result of a trading idea.
Full performance can be found on the company or index summary page on the interactive investor website. Simply click on the company's or index name highlighted in the article.
Important Information
Kepler Partners is not authorised to make recommendations to Retail Clients. This report is based on factual information only, and is solely for information purposes only and any views contained in it must not be construed as investment or tax advice or a recommendation to buy, sell or take any action in relation to any investment.
This report has been issued by Kepler Partners LLP solely for information purposes only and the views contained in it must not be construed as investment or tax advice or a recommendation to buy, sell or take any action in relation to any investment. If you are unclear about any of the information on this website or its suitability for you, please contact your financial or tax adviser, or an independent financial or tax adviser before making any investment or financial decisions.
The information provided on this website is not intended for distribution to, or use by, any person or entity in any jurisdiction or country where such distribution or use would be contrary to law or regulation or which would subject Kepler Partners LLP to any registration requirement within such jurisdiction or country. Persons who access this information are required to inform themselves and to comply with any such restrictions. In particular, this website is exclusively for non-US Persons.
The information in this website is not for distribution to and does not constitute an offer to sell or the solicitation of any offer to buy any securities in the United States of America to or for the benefit of US Persons.
This is a marketing document, should be considered non-independent research and is subject to the rules in COBS 12.3 relating to such research. It has not been prepared in accordance with legal requirements designed to promote the independence of investment research.
No representation or warranty, express or implied, is given by any person as to the accuracy or completeness of the information and no responsibility or liability is accepted for the accuracy or sufficiency of any of the information, for any errors, omissions or misstatements, negligent or otherwise. Any views and opinions, whilst given in good faith, are subject to change without notice.
This is not an official confirmation of terms and is not to be taken as advice to take any action in relation to any investment mentioned herein. Any prices or quotations contained herein are indicative only.
Kepler Partners LLP (including its partners, employees and representatives) or a connected person may have positions in or options on the securities detailed in this report, and may buy, sell or offer to purchase or sell such securities from time to time, but will at all times be subject to restrictions imposed by the firm's internal rules. A copy of the firm's conflict of interest policy is available on request.
Past performance is not necessarily a guide to the future. The value of investments can fall as well as rise and you may get back less than you invested when you decide to sell your investments. It is strongly recommended that Independent financial advice should be taken before entering into any financial transaction.
PLEASE SEE ALSO OUR TERMS AND CONDITIONS
Kepler Partners LLP is a limited liability partnership registered in England and Wales at 9/10 Savile Row, London W1S 3PF with registered number OC334771.
Kepler Partners LLP is authorised and regulated by the Financial Conduct Authority.
Kepler Partners is a third-party supplier and not part of interactive investor. Neither Kepler Partners or interactive investor will be responsible for any losses that may be incurred as a result of a trading idea.
These articles are provided for information purposes only. Occasionally, an opinion about whether to buy or sell a specific investment may be provided by third parties. The content is not intended to be a personal recommendation to buy or sell any financial instrument or product, or to adopt any investment strategy as it is not provided based on an assessment of your investing knowledge and experience, your financial situation or your investment objectives. The value of your investments, and the income derived from them, may go down as well as up. You may not get back all the money that you invest. The investments referred to in this article may not be suitable for all investors, and if in doubt, an investor should seek advice from a qualified investment adviser.
Full performance can be found on the company or index summary page on the interactive investor website. Simply click on the company's or index name highlighted in the article.
Important Information
Kepler Partners is not authorised to make recommendations to Retail Clients. This report is based on factual information only, and is solely for information purposes only and any views contained in it must not be construed as investment or tax advice or a recommendation to buy, sell or take any action in relation to any investment.
This report has been issued by Kepler Partners LLP solely for information purposes only and the views contained in it must not be construed as investment or tax advice or a recommendation to buy, sell or take any action in relation to any investment. If you are unclear about any of the information on this website or its suitability for you, please contact your financial or tax adviser, or an independent financial or tax adviser before making any investment or financial decisions.
The information provided on this website is not intended for distribution to, or use by, any person or entity in any jurisdiction or country where such distribution or use would be contrary to law or regulation or which would subject Kepler Partners LLP to any registration requirement within such jurisdiction or country. Persons who access this information are required to inform themselves and to comply with any such restrictions. In particular, this website is exclusively for non-US Persons. The information in this website is not for distribution to and does not constitute an offer to sell or the solicitation of any offer to buy any securities in the United States of America to or for the benefit of US Persons.
This is a marketing document, should be considered non-independent research and is subject to the rules in COBS 12.3 relating to such research. It has not been prepared in accordance with legal requirements designed to promote the independence of investment research.
No representation or warranty, express or implied, is given by any person as to the accuracy or completeness of the information and no responsibility or liability is accepted for the accuracy or sufficiency of any of the information, for any errors, omissions or misstatements, negligent or otherwise. Any views and opinions, whilst given in good faith, are subject to change without notice.
This is not an official confirmation of terms and is not to be taken as advice to take any action in relation to any investment mentioned herein. Any prices or quotations contained herein are indicative only.
Kepler Partners LLP (including its partners, employees and representatives) or a connected person may have positions in or options on the securities detailed in this report, and may buy, sell or offer to purchase or sell such securities from time to time, but will at all times be subject to restrictions imposed by the firm's internal rules. A copy of the firm's conflict of interest policy is available on request.
Past performance is not necessarily a guide to the future. The value of investments can fall as well as rise and you may get back less than you invested when you decide to sell your investments. It is strongly recommended that Independent financial advice should be taken before entering into any financial transaction.
PLEASE SEE ALSO OUR TERMS AND CONDITIONS
Kepler Partners LLP is a limited liability partnership registered in England and Wales at 9/10 Savile Row, London W1S 3PF with registered number OC334771.
Kepler Partners LLP is authorised and regulated by the Financial Conduct Authority.
These articles are provided for information purposes only. Occasionally, an opinion about whether to buy or sell a specific investment may be provided by third parties. The content is not intended to be a personal recommendation to buy or sell any financial instrument or product, or to adopt any investment strategy as it is not provided based on an assessment of your investing knowledge and experience, your financial situation or your investment objectives. The value of your investments, and the income derived from them, may go down as well as up. You may not get back all the money that you invest. The investments referred to in this article may not be suitable for all investors, and if in doubt, an investor should seek advice from a qualified investment adviser.
Full performance can be found on the company or index summary page on the interactive investor website. Simply click on the company's or index name highlighted in the article.