Stockwatch: why I think these two shares are good value
Noticing contrasts in UK versus US consumer discretionary spending, analyst Edmond Jackson picks a couple of domestic companies to own.
28th June 2024 11:15
by Edmond Jackson from interactive investor

Several companies reporting results over the past week remind us how tricky it remains to discern UK discretionary spending. Affluent US consumers (feeling the highs of technology stocks), meanwhile, are happy to indulge.
AO World (LSE:AO.), the mid-cap electronics retailer, has nearly doubled profit measures in its financial year to 31 March. While this has been helped by dropping non-core and loss-making sales channels, white goods are illustrating an aspect of UK discretionary expenditure being sustained.
- Invest with ii: What is a Managed ISA? | Open a Managed ISA | Top Investment Funds
Yet AIM-listed Sanderson Design Group Ordinary Shares (LSE:SDG), the small-cap luxury furnishings group, has cautioned about a 14% fall in UK brand sales since late April, whereas the US (seen as a strategic growth market) has continued to trade in line with the board’s expectations. This seems a reminder of the lag effect of higher (mortgage) interest rates on purchasing decisions, and also the cost of living despite cooled inflation, given that redecorating is expensive.
Meanwhile, Watches of Switzerland Group (LSE:WOSG), the mid-cap luxury watches retailer, has reported its US side is “going from strength to strength” with 11% sales growth in its financial year to 28 April, edging towards half of total. At least the UK market is “starting to show signs of stabilisation” albeit “impacted by significant price increases at a time of reduced consumer confidence influencing discretionary spending,” WOSG says, although it adds “we see these pressures easing in the April 2025 year.”
Its stock jumped over 10%, settling up 6% at 423p, while AO World slipped 3% to 110p and Sanderson initially plunged 25% to 75/80p on a big spread, recovering to 80/85p on some sizeable buys. This all shows how sentiment remains very responsive to a good story, but care is needed in “consumer discretionary”.
Bulls return to Watches of Switzerland Group
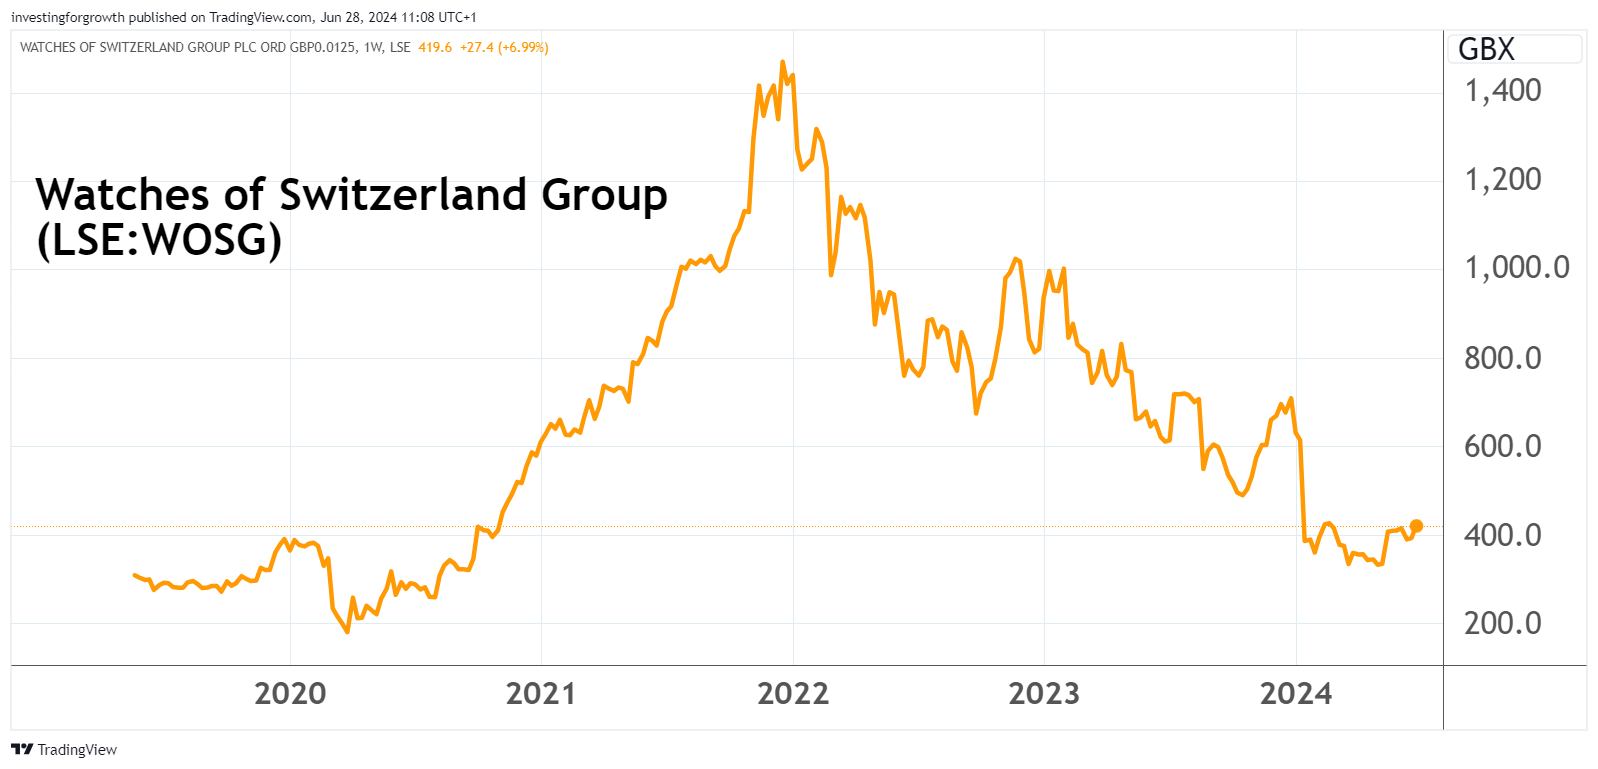
A dilemma for this stock having listed in 2019 is a lack of true long-term performance – for investors to get a measure of it. The share price chart is a rollercoaster, where Covid diverted wealth-spending onto personal luxury items, subsequently impacted in the UK by higher interest rates.

Source: TradingView. Past performance is not a guide to future performance.
Yesterday’s annual results did not add much beyond a 16 May update that cited a better-than-expected fourth quarter to 31 January due to strong US trading, which at the time helped the stock up 11% to 374p.
At 425p, the stock trades on 10x consensus earnings for the end-April 2025 year, easing below 9x in respect of 2026. This assumes management’s story about how its market should stabilise, with the luxury watch industry being more conservative on production. Investors have also responded well to May’s acquisition of Roberto Coin, the sixth-largest jewellery brand in the US.
- Sign up to our free newsletter for share, fund and trust ideas, and the latest news and analysis
- Election manifestos 2024: the impact on your personal finances
- ii view: Watches of Switzerland sets optimistic tone
In January, the stock plunged nearly 40% to around 370p in response to a “volatile” Christmas trading update – specifically due to the UK – which guided for these conditions to continue. So when the February to April quarter proved better, it has prompted recovery.
I am surprised that there’s no dividend policy – which could mitigate stock downside – given retail is inherently cash-generative and WOSG shows a good record of free cash flow beating earnings:
| Watches of Switzerland Group - financial summary | ||||||||
| Year-end 30 April | 2017 | 2018 | 2019 | 2020 | 2021 | 2022 | 2023 | 2024 |
| Turnover (£ million) | 509 | 631 | 774 | 811 | 905 | 1,238 | 1,543 | 1,538 |
| Operating margin (%) | 4.5 | 5.9 | 5.9 | 2.4 | 9.0 | 11.5 | 11.5 | 7.7 |
| Operating profit (£m) | 22.6 | 37.4 | 45.3 | 19.8 | 81.9 | 142 | 178 | 119 |
| Net profit (£m) | 5.3 | 0.4 | -1.8 | 0.5 | 50.6 | 101 | 122 | 59.1 |
| EPS - reported (p) | 0.9 | 0.1 | 5.8 | 0.2 | 21.1 | 42.0 | 50.9 | 24.8 |
| EPS - normalised (p) | 2.7 | 0.9 | 8.1 | 28.0 | 26.3 | 43.1 | 51.3 | 33.8 |
| Operating cashflow/share (p) | 19.5 | 19.8 | 26.9 | 40.7 | 71.7 | 70.8 | 88.5 | 80.3 |
| Capital expenditure/share (p) | 7.4 | 6.2 | 15.1 | 12.3 | 10.9 | 18.3 | 32.5 | 35.3 |
| Free cashflow/share (p) | 12.1 | 13.6 | 11.8 | 28.5 | 60.9 | 52.5 | 56.1 | 45.0 |
| Dividends per share (p) | 0.0 | 0.0 | 0.0 | 0.0 | 0.0 | 0.0 | 0.0 | 0.0 |
| Return on total capital (%) | 12.5 | 10.3 | 13.2 | 3.4 | 12.8 | 18.2 | 18.3 | 11.3 |
| Cash (£m) | 17.3 | 37.6 | 27.5 | 66.5 | 66.2 | 92.1 | 122 | 116 |
| Net debt (£m) | 105 | 247 | 240 | 441 | 353 | 367 | 409 | 458 |
| Net assets (£m) | 51.0 | 85.1 | 76.6 | 200 | 250 | 361 | 469 | 523 |
| Net assets per share (p) | 21.3 | 35.5 | 32.0 | 83.3 | 105 | 151 | 196 | 218 |
| Source: historic Company REFS and company accounts | ||||||||
I incline toward a “buy” stance despite some concern about how luxury spending will pan out in the UK. How might the crackdown on non-doms affect luxury watch demand in the wake of fewer wealthy Russians visiting London since 2022?
WOSG is a prime example of the “UK versus US” discretionary spending dilemma but, given its modest rating of earnings and especially cash flow, perhaps its stock can climb this wall of worry.
Parallels and ironies between Sanderson and Colefax
Older investors may remember “Walker Greenbank” plc, which in the 1980s diversified as a fashionable mini-conglomerate, hitting its own troubles and which restructured around luxury interior furnishings. The resulting modern dilemma, I find, is the post-Covid hike in prices such as redecorating work, makes “luxury interior” particularly sensitive – despite the rich generally getting richer.
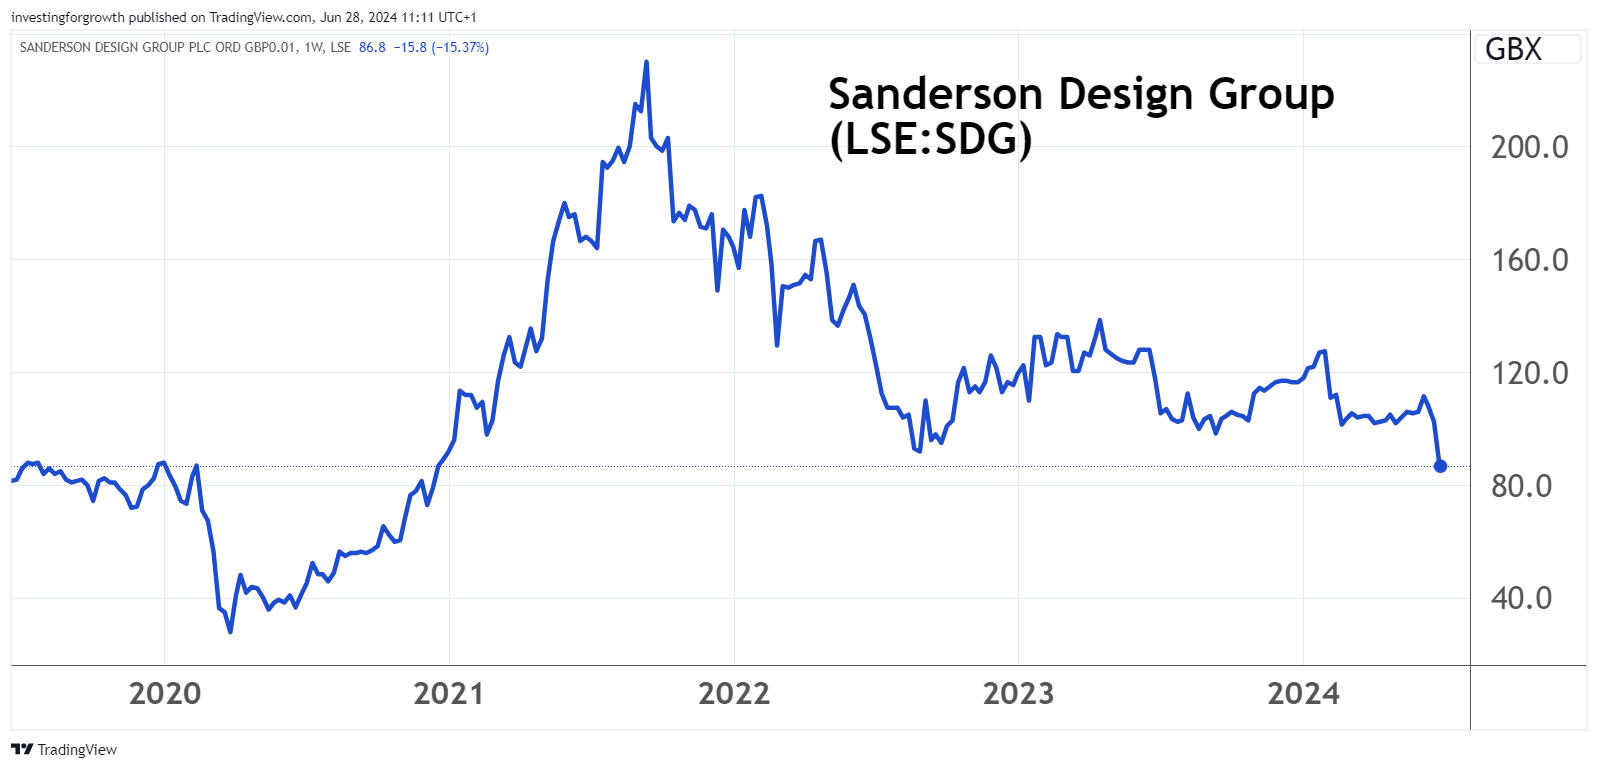
The stock has essentially mean-reverted to where it was before Covid and the boom in home improvements:

Source: TradingView. Past performance is not a guide to future performance.
Total brand product sales are down 9% in the first 22 weeks of Sanderson’s year to end-January 2025, albeit the UK down 14% “reflecting a worsening of market conditions.”
The hit to profits is made harder by inflationary pressures pushing up costs. As with WOSG, the US side has continued to perform well, albeit in this case slightly below expectations.
Underlying pre-tax profit is thus guided at about £8 million despite the financial year-end being seven months away. No previous estimates are given (or at April’s final results) but it looks a near 25% downgrade given consensus has been for £9.4 million net profit. With 2025 earnings per share therefore looking at around 10p at best, the price/earnings (PE) multiple is around 8.5x and prospective yield over 4%.
While this can appear fair pricing for the risks, including a Labour government raising taxes on the wealthier, the modest rating is interesting – also for takeover potential, given the stock now trades around net tangible asset value. It is a tricky call, but I incline towards a “buy”.
Sanderson’s situation was accurately foreshadowed last January by AIM-listed Colefax Group (LSE:CFX), a £54 million designer and international distributor of furnishing fabrics and wallpapers. Its interim results to 31 October declared:
“Trading in all our major markets is starting to reflect the impact of high interest rates and lower levels of housing market activity. We are expecting conditions to become more difficult especially as customer spending on our products tends to lag changes in housing market activity and we believe trading conditions are likely to remain challenging for much of the next financial year...”
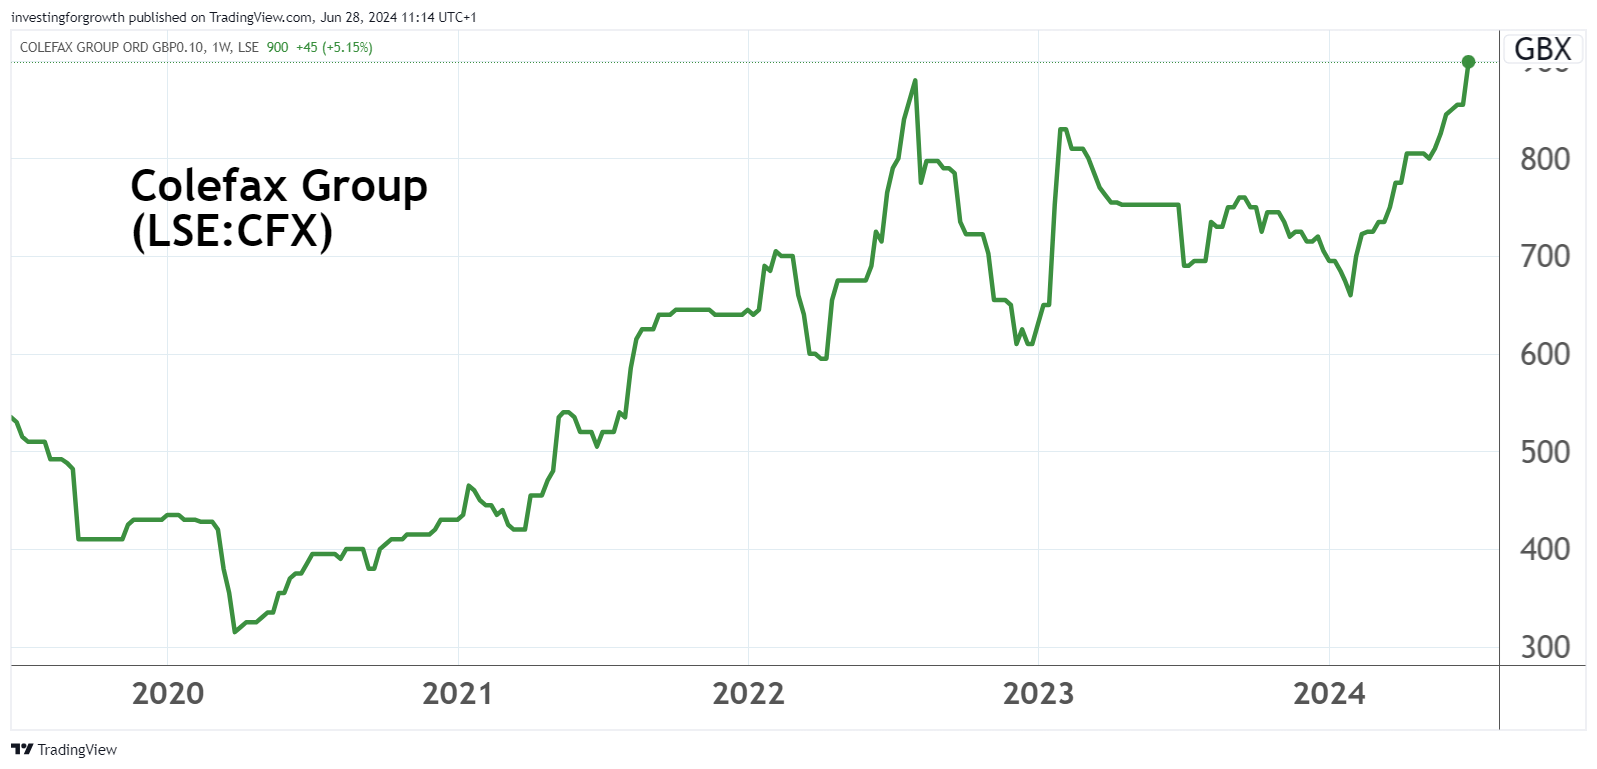
Yet its stock has risen a third from 655p since that 31 January update to 875p, and despite first-half pre-tax profit dropping 16% on revenue up 3% at constant currency. The forward PE looks to be around 15x and yield below 1%, with market value towards two times tangible net asset value. It is quite an anomaly versus Sanderson.

Source: TradingView. Past performance is not a guide to future performance.
AO World claims it can restore double-digit revenue growth
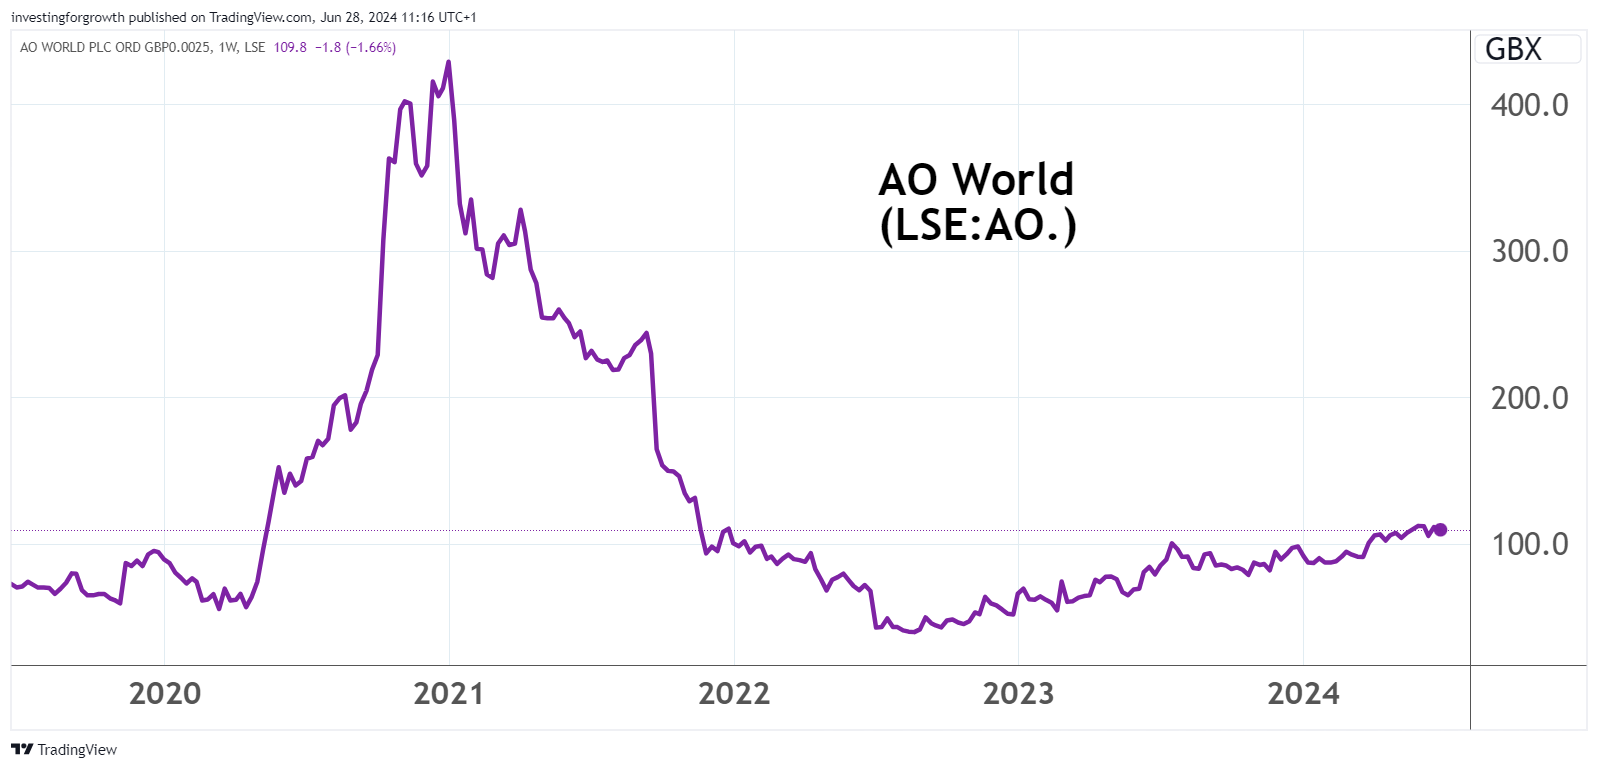
The chart exhibits quite a boom/bust around demand for entertainment electrical goods during lockdowns, with a full “mean-reversion to pre-Covid levels:

Source: TradingView. Past performance is not a guide to future performance.
In autumn 2021, I took two “sell” stances at 158p and 106p and the price dipped briefly below 40p nearly a year later. But the price has steadily recovered, back above 100p from the end of last March when a trading update suggested pre-tax profit expectations to be “at least the top of a £28-33 million” previously guided range.
- Profits surprise at revitalised AO World
- Stockwatch: UK takeover interest shifts to quality consumer brands
Yesterday’s prelims to 31 March achieved £34.3 million adjusted pre-tax profit, although the PE multiple is nearly 27x that outcome – reducing below 20x if normalised EPS rises from 4p to near 6p by the March 2026 year. There is no dividend, again a curiosity for a broadly cash-generative retailer with free cash flow ahead of earnings.
I have thus been inherently cautious of AO World, but if management can “use this strong foundation” (having removed non-core and loss-making sales channels) and “move the business back to being a double-digit revenue growth business in the year ahead”, then at 111p I will not dispute those who hold it.
Edmond Jackson is a freelance contributor and not a direct employee of interactive investor.
These articles are provided for information purposes only. Occasionally, an opinion about whether to buy or sell a specific investment may be provided by third parties. The content is not intended to be a personal recommendation to buy or sell any financial instrument or product, or to adopt any investment strategy as it is not provided based on an assessment of your investing knowledge and experience, your financial situation or your investment objectives. The value of your investments, and the income derived from them, may go down as well as up. You may not get back all the money that you invest. The investments referred to in this article may not be suitable for all investors, and if in doubt, an investor should seek advice from a qualified investment adviser.
Full performance can be found on the company or index summary page on the interactive investor website. Simply click on the company's or index name highlighted in the article.
Disclosure
We use a combination of fundamental and technical analysis in forming our view as to the valuation and prospects of an investment. Where relevant we have set out those particular matters we think are important in the above article, but further detail can be found here.
Please note that our article on this investment should not be considered to be a regular publication.
Details of all recommendations issued by ii during the previous 12-month period can be found here.
ii adheres to a strict code of conduct. Contributors may hold shares or have other interests in companies included in these portfolios, which could create a conflict of interests. Contributors intending to write about any financial instruments in which they have an interest are required to disclose such interest to ii and in the article itself. ii will at all times consider whether such interest impairs the objectivity of the recommendation.
In addition, individuals involved in the production of investment articles are subject to a personal account dealing restriction, which prevents them from placing a transaction in the specified instrument(s) for a period before and for five working days after such publication. This is to avoid personal interests conflicting with the interests of the recipients of those investment articles.