Stockwatch: time to take profits after 600% gain?
This AIM share has had an incredible run since analyst Edmond Jackson backed them to do well. Here’s his latest analysis on this successful share tip.
22nd October 2024 12:49
by Edmond Jackson from interactive investor

Has the underlying risk/reward profile in AIM-listed shares of Cerillion (LSE:CER), a telecoms billing software group, now become unfavourable despite an apparently firm uptrend on its chart?
- Invest with ii: Open a Stocks & Shares ISA | ISA Investment Ideas | Transfer a Stocks & Shares ISA
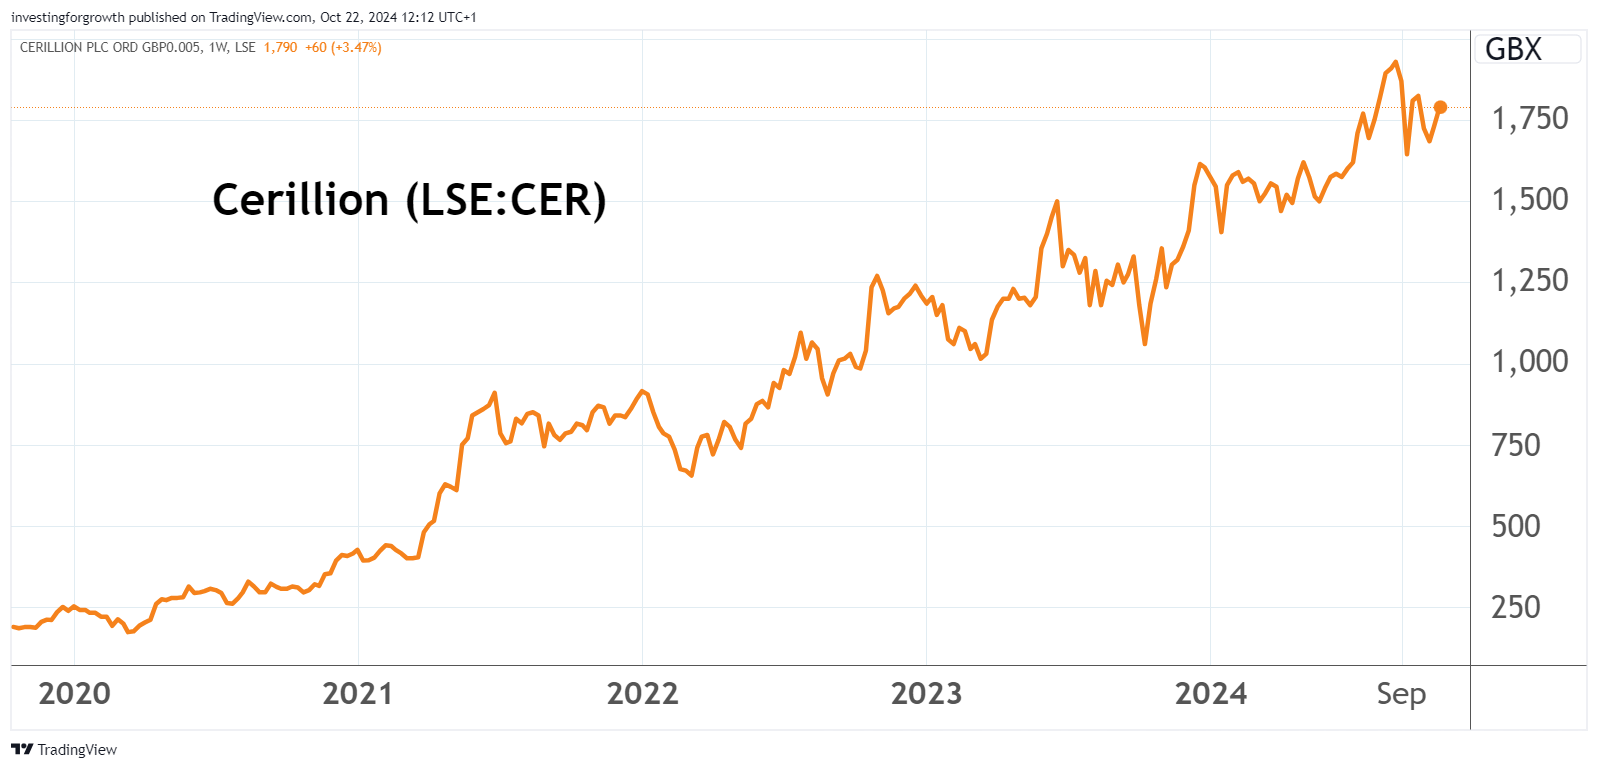
Source: TradingView. Past performance is not a guide to future performance.
Adages conflict, like they are prone to. We are told “run your winners” but also “be sure to lock some gains on the way up”, especially if a holding becomes overweight in the context of your portfolio. The underlying ideas being that success is likely to beget more as an attractive concept gets established, yet any setback can hurt portfolio performance when the stock rating is high.
I originally drew attention to Cerillion as a “buy” at 245p in April 2020. I did so again at 820p in April 2022 in a sense of it being better late than never - the stock had powered from around 100p in 2016 – yet revenue was growing at mid-20% rates. Operational gearing was also manifest, where profits are greater than revenue, with one such measure up nearly 50%.
With the price reaching 1,950p last August this has worked well, yet to be critical the stock was in a sideways trend from last January to July, then a modest re-rate from around 1,600p to near 1,900p despite no fresh news, and has been sideways-volatile for the last three months. It would seem over-exacting to fuss about this, were it not that Cerillion’s numbers have conveyed revenue/profit gains this year at more like 10%.
With the forward price/earnings (PE) ratio possibly over 30 times, that implies a price/earnings to growth (or PEG) ratio around three times, which is expensive. Generally, you would search for sub-zero and be alert to two times as possible overvaluation, hence we need some confidence from Cerillion’s narrative that there is latent growth.
Teases about order prospects converting into contracts
In April, I noted this moderation in the revenue growth rate to 10% and how operational gearing was gone from an update in respect of the six months to 31 March. It’s as if costs had risen or the business reached a scale where it no longer applies. A strong pipeline was cited with “a number of substantial potential new contracts at various stages of negotiation”, which led me to think there was scope for upgrading the 10% revenue growth rate. In due respect, the roll-out of full-fibre broadband and 5G on which Cerillion is capitalising, continues.
- Where to invest in Q4 2024? Four experts have their say
- Sign up to our free newsletter for investment ideas, latest news and award-winning analysis
One such contract in Southern Africa was announced in May – worth an initial £8.5 million, equivalent to over five years and with “scope to develop further over time”. But none further were cited, as if insufficiently material.
This latest pre-close update simply cites total new orders signed in the 30 September year as “significantly greater than in any previous year, reflecting new customer wins as well as the growing value of the installed base. The full benefit of these new orders is still to come through.”
This is where projections get speculative. Implicitly, none aside from the African one are sufficient to merit announcement. The update hints at “some large opportunities” in the current pipeline, against also a “robust back-order book” (sales contracted but not yet recognised as revenue). Cerillion shares would probably respond well to such news. But their aspect of sideways volatility suggests the market well appreciates the growth story, and the valuation is rich.
The stock has edged up around 3% to test 1,800p, cheered by the overall tone of the update. Yet its September 2024 revenue guidance of £43.8 million appears slightly short of consensus for £44.4 million and would be a near 12% increase on September 2023.
Again, the timing of contract initiation introduces some variance, but let us say I was expecting more like 15% growth or better. The implied price/sales ratio of 12x, with market capitalisation around £525 million, is colossal and hard to justify.
Adjusted pre-tax profit is said to be “comfortably ahead” of consensus for £17.9 million, but if, say, around £19 million, that would represent only a modest 13% advance on 2023, relative to a trailing PE of 36x the implied adjusted earnings per share (EPS) around 49p. At least the pre-tax profit margin would be a very respectable 43%.
Risk/reward profile is thus finely balanced
It has become hard to define intrinsic value on a medium to long-term basis, given it looks rich now, plus the challenge to guess how the telecoms landscape will evolve. Might it involve consolidation of demand for services, sometime in the next three years, then another wave of growth as 6G is heralded?
- Insider: buying a winter winner plus big sales in the FTSE 250
- Shares for the future: an each-way bet on future of manufacturing
Versus an earnings growth rate tempering to modest double digits relative to 148% in 2021 and 69% in 2022, the prospective dividend yield is just 0.8% – assuming the payout edges up in line with consensus for 12.5p this latest year and 13.8p in respect of September 2025.
Ordinarily, the justification for a low payout – only around 25% of prospective earnings and possibly 40% of free cash flow – would be if investing actively. Cerillion’s returns on equity and total capital have soared into a mid-30% region and net cash has increased from £25 million near £30 million over the year.
Cerillion - financial summary
Year-end 30 Sep
| 2016 | 2017 | 2018 | 2019 | 2020 | 2021 | 2022 | 2023 | |
| Turnover (£ million) | 8.4 | 16.0 | 17.4 | 18.8 | 20.8 | 26.1 | 32.7 | 39.2 |
| Operating margin (%) | 5.2 | 13.1 | 10.9 | 13.4 | 13.5 | 28.9 | 32.7 | 39.0 |
| Operating profit (£m) | 0.4 | 2.1 | 1.9 | 2.5 | 2.8 | 7.5 | 10.7 | 15.3 |
| Net profit (£m) | 0.3 | 2.0 | 1.9 | 2.3 | 2.6 | 6.4 | 9.3 | 12.9 |
| EPS - reported (p) | 1.3 | 6.9 | 6.5 | 7.8 | 8.8 | 21.7 | 31.6 | 43.7 |
| EPS - normalised (p) | 3.4 | 6.9 | 6.8 | 7.8 | 8.8 | 21.7 | 36.7 | 44.3 |
| Operating cashflow/share (p) | -3.5 | 11.7 | 12.5 | 17.1 | 22.2 | 33.1 | 41.7 | 32.9 |
| Capital expenditure/share (p) | 3.2 | 3.6 | 5.6 | 4.1 | 4.8 | 4.3 | 5.4 | 4.8 |
| Free cashflow/share (p) | -6.7 | 8.1 | 6.9 | 13.0 | 17.4 | 28.8 | 36.3 | 28.1 |
| Dividends per share (p) | 3.9 | 4.2 | 4.5 | 4.9 | 5.5 | 7.1 | 9.1 | 8.0 |
| Covered by earnings (x) | 0.3 | 1.6 | 1.4 | 1.6 | 3.1 | 3.5 | 3.5 | 5.5 |
| Return on total capital (%) | 2.4 | 12.0 | 11.1 | 14.8 | 13.0 | 29.7 | 34.1 | 37.3 |
| Cash (£m) | 5.0 | 5.3 | 5.3 | 6.8 | 8.3 | 13.2 | 20.2 | 24.7 |
| Net debt (£m) | -0.4 | -1.7 | -2.5 | -5.0 | -2.1 | -8.4 | -16.2 | -21.6 |
| Net assets (£m) | 13.0 | 13.8 | 14.4 | 15.5 | 16.0 | 20.2 | 26.7 | 36.9 |
| Net assets per share (p) | 43.9 | 46.6 | 48.9 | 52.7 | 54.5 | 68.8 | 90.9 | 125 |
Source: historic company REFS and company accounts.
Yet the interim results to 31 March show investment comprising only 11% of £5.3 million net cash generated from operations during the period. The eight-year table suggests a strong financial base to pay out more, and a special dividend of, say, £10 million would be near 34p – albeit still short of a 2% return.
Cerillion’s market value therefore rests significantly on the confidence of growth-oriented investors to keep buying the story. The situation has become a test of whether you trust the chart – which says it is premature to sell – or fundamental valuation yardsticks saying it is over-priced.
To some extent, macro considerations are at work: falling interest rates in theory benefit growth stocks, so there might be a modest tailwind there.
- Stockwatch: another share to watch after tip doubles in 4 months
- eyeQ: mood music changes for markets
The stock remains exposed to any disappointments or simply buyer fatigue. Perhaps its drop from over 1,800p to below 1,700p in the first two weeks of October partly reflects speculation over the 30 October Budget possibly removing business relief from AIM stocks.
Now Israel has allegedly promised the US that it will not sabotage Iranian oil facilities as part of retaliation, mercifully we appear spared from financial turmoil this autumn, say, if oil prices were to soar.
I would at least ensure profits are taken here, to an extent you are comfortable with your risk appetite and portfolio balance. An outright “sell” stance seems premature given Cerillion can still grow into its hefty valuation. But its growth rates need to rally again, and the market may in due course want that evidence. Be vigilant. Hold.
Edmond Jackson is a freelance contributor and not a direct employee of interactive investor.
AIM stocks tend to be volatile high-risk/high-reward investments and are intended for people with an appropriate degree of equity trading knowledge and experience.
These articles are provided for information purposes only. Occasionally, an opinion about whether to buy or sell a specific investment may be provided by third parties. The content is not intended to be a personal recommendation to buy or sell any financial instrument or product, or to adopt any investment strategy as it is not provided based on an assessment of your investing knowledge and experience, your financial situation or your investment objectives. The value of your investments, and the income derived from them, may go down as well as up. You may not get back all the money that you invest. The investments referred to in this article may not be suitable for all investors, and if in doubt, an investor should seek advice from a qualified investment adviser.
Full performance can be found on the company or index summary page on the interactive investor website. Simply click on the company's or index name highlighted in the article.
Disclosure
We use a combination of fundamental and technical analysis in forming our view as to the valuation and prospects of an investment. Where relevant we have set out those particular matters we think are important in the above article, but further detail can be found here.
Please note that our article on this investment should not be considered to be a regular publication.
Details of all recommendations issued by ii during the previous 12-month period can be found here.
ii adheres to a strict code of conduct. Contributors may hold shares or have other interests in companies included in these portfolios, which could create a conflict of interests. Contributors intending to write about any financial instruments in which they have an interest are required to disclose such interest to ii and in the article itself. ii will at all times consider whether such interest impairs the objectivity of the recommendation.
In addition, individuals involved in the production of investment articles are subject to a personal account dealing restriction, which prevents them from placing a transaction in the specified instrument(s) for a period before and for five working days after such publication. This is to avoid personal interests conflicting with the interests of the recipients of those investment articles.