Stockwatch: stake-building hints at recovery upside here
After a spectacular collapse, this share has recovered a little of its losses, and analyst Edmond Jackson believes there’s still time to get on board.
20th September 2024 12:52
by Edmond Jackson from interactive investor

Are recovery prospects at video games developer Frontier Developments (LSE:FDEV) coming together, or is this investment still highly speculative?
Viking Global Investors thinks now is the time to buy at around 245p; its Viking Capital subsidiary has in recent months accumulated a 5% stake in this £97 million company. It does, however, manage £44 billion equivalent, so may prefer a few higher-risk/reward plays as part of diversification in pursuit of capital growth.
- Invest with ii: Top UK Shares | Free Regular Investing | What is a Managed ISA?
Yesterday, it was announced that this stake had increased implicitly from 1.9% last July, hence appears to be a verdict on Frontier’s annual results to 31 May, declared last Friday. Mind that in July and at end-August respectively, Arcadian Asset Management trimmed its stake modestly to 2.6% and Invesco to 5.6%.
I examined Frontier last November at 147p after a 96% share price fall, intrigued as to whether a “mean” or average performance rate for the business could exist – somewhere in between the exceptional demand for games during Covid lockdowns and its aftermath.
The stock chart shows a classic boom/bust pattern around Covid. Frontier floated at 127p in mid-2013 it peaked above 3,300p then ceded nearly all of it:
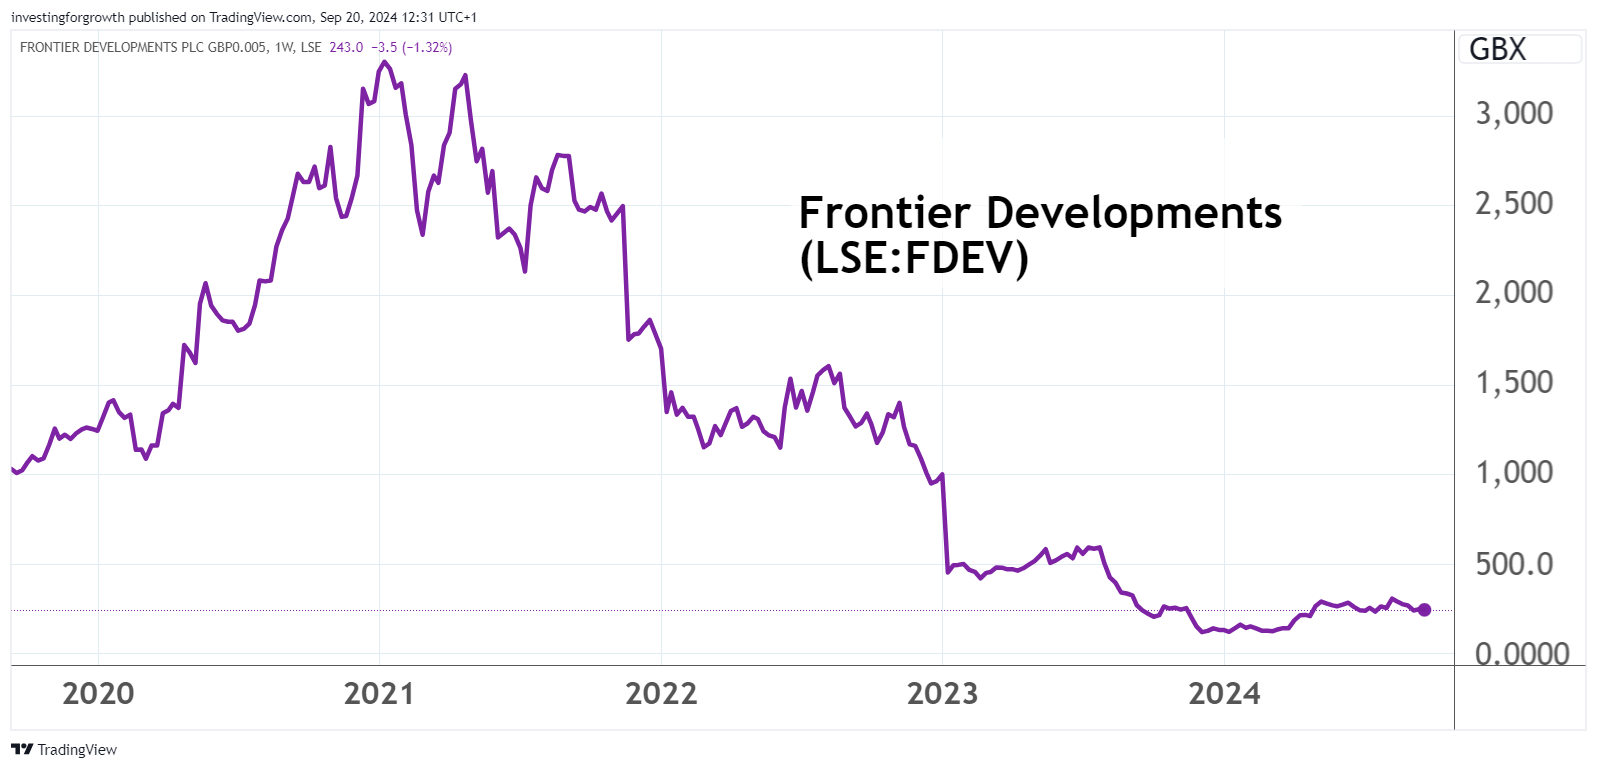
Source: TradingView. Past performance is not a guide to future performance.
At 147p I sought more evidence so rated the shares a “hold”. The price did ease to a 130p range in this year’s first quarter after revenue fell, then losses increased at January’s interim results to 30 November. But an “in line” trading update on 2 April was enough to trigger a run from 140p to 225p, although it’s unclear whether insiders sensed what was in store, as a more bullish update on 7 May saw this rally continue to 300p.
It has been a good example of whether to take your cue mainly from the chart – anticipating some extent of mean-reversion upwards – or insist on proof in numbers, especially profit. Frontier guided expectations for adjusted earnings before interest, tax, depreciation and amortisation (EBITDA) upwards last May.
Perhaps a more important call is whether the business overall is now on the cusp. This stock has been in a sideways-volatile trend since May - it was down to 230p earlier this month and it slipped 3% to 247p yesterday compared with rises elsewhere in response to the US interest rate cut.
- Rolls-Royce among UK stocks benefiting from big US rate cut
- Sign up to our free newsletter for investment ideas, latest news and award-winning analysis
A tale of two financial half-years, and better prospects
Annual results to 31 May showed revenue disappointingly down 15% to £89 million, although a £97 million market value implies a modest price/sales ratio of 1.1x at 245p currently – such that if costs are better managed and return on investment kicks in, the PS ratio should be roughly 1.5x at least.
The narrative cites under-performing game launches in the first half, partly offset by a strong back catalogue performance of “creative management simulation” games mimicking real-life situations. CMS outperformance persisted into the second half, meaning the annual revenue fall was ahead of expectations.
A carrot is dangled by way of the strongest-ever release of games set to launch over the next three years. Among the titles, Planet Coaster 2 is due to launch this autumn, hence scope for useful news from reviews, leading to user numbers; then a third Jurassic World game in the May 2026 year and a further (as yet unannounced game) in 2027. Unless more are under wraps, that implies reliance on several proving hits.
Alongside better revenue prospects, management says it has cut annual operating costs by 20%, albeit they’re yet to manifest given the annual income statement shows sales and marketing costs down only 3% to £11.6 million and administrative expenses also by 3% to £13.7 million. Implicitly, they mean “run-rate”.
- eyeQ: why Lloyds Bank shares just triggered a bullish signal
- Legal & General investors unhappy with £1.2bn Cala Homes sale
The biggest cost element is £68 million research and development expenses, the same as the May 2023 year, although it’s unclear whether that is included (I rather doubt) in boasting 20%-lower costs. Sometimes, intellectual property development companies do go through investment phases that lead to harvesting, but in games there seems an element of “running to stand still” – always needing to prepare a next big release. See the material element of annual capital expenditure persisting in Frontier’s eight-year table below.
But combine these two broad elements – potentially improving sales against lower costs – and there is scope for quite an inflection point. The table shows £18 million net profit achieved on similar £89 million revenue in the May 2019 year; the little difference between operating and net profits in the trend over years implies benefits from tax credits linked to R&D.
This company has achieved reported operating margins over 20% in four of the past years from 2016:
Frontier Developments - financial summary
Year end 31 May
| 2016 | 2017 | 2018 | 2019 | 2020 | 2021 | 2022 | 2023 | 2024 | |
| Turnover (£ million) | 21.4 | 37.4 | 34.2 | 89.7 | 76.1 | 90.7 | 114 | 105 | 89.3 |
| Operating margin (%) | 5.8 | 20.9 | 8.2 | 21.6 | 21.8 | 22.0 | 1.4 | -25.4 | -31.8 |
| Operating profit (£m) | 1.2 | 7.8 | 2.8 | 19.4 | 16.6 | 19.9 | 1.5 | -26.6 | -28.4 |
| Net profit (£m) | 1.4 | 7.7 | 3.6 | 18.0 | 15.9 | 21.6 | 9.6 | -20.9 | -21.5 |
| Reported EPS (p) | 4.1 | 22.4 | 9.1 | 44.7 | 39.4 | 53.3 | 23.7 | -53.6 | -55.6 |
| Normalised EPS (p) | 4.1 | 22.4 | 9.1 | 44.7 | 39.4 | 53.3 | 35.6 | -23.4 | -53.2 |
| Return on total capital (%) | 5.1 | 23.5 | 5.0 | 25.6 | 13.0 | 13.9 | 1.1 | -22.4 | -28.4 |
| Operating cashflow/share (p) | -3.6 | 13.5 | 25.9 | 81.5 | 80.4 | 96.3 | 101 | 123 | 81.9 |
| Capex/share (p) | 1.0 | 2.3 | 46.0 | 42.9 | 53.8 | 81.2 | 95.4 | 111 | 78.7 |
| Free cashflow/share (p) | -4.6 | 11.2 | -20.1 | 38.6 | 26.6 | 15.1 | 5.6 | 12.0 | 3.2 |
| Cash (£m) | 8.6 | 12.6 | 24.1 | 35.3 | 45.8 | 42.4 | 38.7 | 28.3 | 29.5 |
| Net debt (£m) | -8.6 | -12.6 | -24.1 | -35.3 | -22.2 | -20.3 | -18.0 | -9.0 | -8.2 |
| Net assets (£m) | 22.8 | 31.3 | 55.3 | 74.2 | 96.7 | 113 | 118 | 96.0 | 76.8 |
| Net assets/share (p) | 66.8 | 91.4 | 143 | 192 | 249 | 288 | 300 | 243 | 195 |
Source: historic Company REFS and company accounts
Radical cash flow elements, albeit potentially reducing PE
The May 2024 annual results highlight cash up 4% to £29.5 million, although referencing the cash flow statement, cash generated from operations halved to £22 million.
After this and on the investing side, investment in new titles eased 30% to £29 million, and on the financing side £9 million tax was received. There was also no repeat of £3 million share purchases for an employee trust in 2023, nor a £1.3 million loan repayment. There were, hence, some significant dynamics within the slight rise in cash held, and the outcome could have been different than a pleasing rise.
It is speculative but, yes, there are grounds to believe Frontier can mean-revert its performance – the chief uncertainty being, to what degree?
Consensus anticipates a small normalised loss for the current financial year and only £1 million net profit in 2026. Unless R&D costs continue to weigh heavily, I sense this is probably cautious guidance from the company to its broker, and there is scope to outperform.
While the May 2026 price/earnings (PE) multiple is 80x based on projected earnings per share (EPS) of 3.1p, eventual mean-reversion towards EPS more like 20p would imply a PE of 12x.
A case for intangible value
A “price-to-book” ratio under 1.3x (book value of 195p) along with 1.1x price/sales, seems another indicator how, if management has an astute grip, the return on assets can be raised.
Looking back to 2016, for example, a share price around 200p compared with net asset value near 67p a share, hence a 3x ratio. Frontier made only £1.4 million net profit that year; the premium correctly anticipated the advance to £18 million in respect of May 2019 (before Covid lockdown sales manifested).
While 56% of net assets comprise mainly intangibles also goodwill, you can expect this for an intellectual property type business.
Warren Buffett has argued – primarily regarding newspapers – that intangible values are integral to modern business valuation. Implicitly, such a view included brand loyalty to Apple Inc (NASDAQ:AAPL), which (through success) became Berkshire Hathaway Inc Class B (NYSE:BRK.B)’s biggest holding.
- Buffett stashes cash: should investors follow?
- Stockwatch: time to worry over Warren Buffett’s rapid sales?
Obviously, the more rapid turnover in video games does not have a general loyalty factor to the extent of The Washington Post or Apple advancing the iPhone brand. Frontier wrote down its “other intangible assets” by 37% to £35.7 million over the last financial year due to amortisation and impairment.
So, there is a case for intangible value albeit lacking longevity.
A ‘good’ start to the new financial year
While a top management might strictly be positioned now to quantify the first quarter, Frontier cites “ongoing strength with the CMS-led back catalogue, with Planet Zoo and Jurassic World Evolution 2 again the star performers.
There is a “fear of missing out” aspect to my conclusion, after awaiting more proof last November and ending up missing a two-thirds re-rating to the current price, or more than doubling to over 300p since May. But there seem decent odds that the business at least is on a rising trend once again.
Frontier is speculative, yet Viking’s stake-building affirms my sense that the shares are a Buy.
Edmond Jackson is a freelance contributor and not a direct employee of interactive investor.
AIM stocks tend to be volatile high-risk/high-reward investments and are intended for people with an appropriate degree of equity trading knowledge and experience.
These articles are provided for information purposes only. Occasionally, an opinion about whether to buy or sell a specific investment may be provided by third parties. The content is not intended to be a personal recommendation to buy or sell any financial instrument or product, or to adopt any investment strategy as it is not provided based on an assessment of your investing knowledge and experience, your financial situation or your investment objectives. The value of your investments, and the income derived from them, may go down as well as up. You may not get back all the money that you invest. The investments referred to in this article may not be suitable for all investors, and if in doubt, an investor should seek advice from a qualified investment adviser.
Full performance can be found on the company or index summary page on the interactive investor website. Simply click on the company's or index name highlighted in the article.
Disclosure
We use a combination of fundamental and technical analysis in forming our view as to the valuation and prospects of an investment. Where relevant we have set out those particular matters we think are important in the above article, but further detail can be found here.
Please note that our article on this investment should not be considered to be a regular publication.
Details of all recommendations issued by ii during the previous 12-month period can be found here.
ii adheres to a strict code of conduct. Contributors may hold shares or have other interests in companies included in these portfolios, which could create a conflict of interests. Contributors intending to write about any financial instruments in which they have an interest are required to disclose such interest to ii and in the article itself. ii will at all times consider whether such interest impairs the objectivity of the recommendation.
In addition, individuals involved in the production of investment articles are subject to a personal account dealing restriction, which prevents them from placing a transaction in the specified instrument(s) for a period before and for five working days after such publication. This is to avoid personal interests conflicting with the interests of the recipients of those investment articles.