Stockwatch: is the rally in these consumer shares justified?
3rd February 2023 10:24
by Edmond Jackson from interactive investor
Inflation is sky high and the era of ultra-low mortgage rates is over, but this sector has enjoyed a powerful rebound in recent months. Analyst Edmond Jackson gives his view.

Some of the most powerful rebounds lately have been consumer stocks such as ASOS (LSE:ASC) and JD Sports Fashion (LSE:JD.) – up 101% and 86% respectively since mid-October.
Lest this represents a unique segment in the population – younger adults still living with parents – more traditional retailers have also joined the party.
ScS Group (LSE:SCS), a retailer of upholstered furniture and floorings, is up 80% and Brown (N) Group (LSE:BWNG) has doubled in value since the end of October.
- Invest with ii: Share Dealing with ii | Open a Stocks & Shares ISA | Our Investment Accounts
Meanwhile, over in the US, a Greed & Fear Index is at 72%, where 75% marks Extreme Greed – as if sentiment has swung generally.
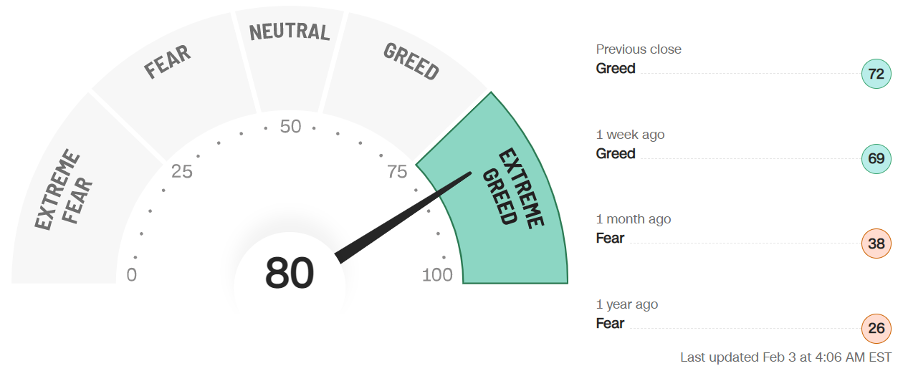
Source: CNN. The Fear & Greed Index is a way to gauge stock market movements and whether stocks are fairly priced. The theory is based on the logic that excessive fear tends to drive down share prices, and too much greed tends to have the opposite effect.
Admittedly, UK stock lows were exaggerated by last October’s mini-budget fiasco, yet rallies were reinforced by ratings which were far too pessimistic.
Stocks possibly gained impetus yesterday from the Bank of England anticipating a much shallower decline in UK output relative to its last forecast in November, and for consumer price inflation to fall to around 4% towards the end of this year.
Yet this springtime the UK energy cap will be removed, and near 15% rises in telecom bills and 8% for water will kick in.
UK banks are also starting to put aside more cash as protection versus potential defaults. Santander, for example, says inflation will continue to eat away at disposable income and affect credit quality.
ScS has lately shown palpable signs of resilience
Just after Christmas, I noticed in Lincoln a gridlocked car park as shoppers tried to reach the local ScS outlet and Pets at Home (LSE:PETS). It’s unclear to what extent a rather full ScS store translated into revenues, but both companies have issued firm updates.
ScS affirms how negativity over consumer spending became overdone. Reflecting its first-half-year to the end of January, like-for-like order intake eased 4.7% overall, however, within this, it said: “Like-for-like order intake momentum improved significantly throughout the period, with the group returning to growth of 2.6% in the last 10 weeks, which included the key winter sale. As previously reported, like-for-like performance in the first 16 weeks had a tough comparative (stores re-opening, post-Covid lockdowns).”
The period may also have benefited slightly from opening two new stores in Swindon and York, for a UK total of 100, and also strategy being refreshed. Yet the mid-November AGM had cited “planning to approach the important winter sales period in a manner consistent with which has proved successful in prior years”.
It marks a positive shift in narrative, relative to an update six months ago, which cited July 2022 annual profit ahead of expectations albeit with orders declining. Lower consumer confidence would impact the July 2023 year. It was open-ended uncertainty, hence negative speculation leading to last October’s stock low.
Some retailers are benefiting from trading down, where ScS is more a value than luxury retailer. Fourth-quarter 2022 sales and profits for McDonald's Corp (NYSE:MCD) beat expectations, and while raising its prices helped, this would not have been possible without keen demand as people switched from pricier restaurants.
- 10 shares to give you a £10,000 annual income in 2023
- ii view: McDonald's profit win overshadowed by inflation
Does a re-rating mean fair pricing, or is there further to go?
ScS’s long-term chart is a sideways roller coaster over 20 years, which, considering it is still only a £75 million company, begs questions as to growth credentials.
Given relatively tight liquidity also, such a stock is likely to be priced for a meaningful yield – here, over 5% on a 12-month forward basis if forecasts are fair.
The 2020-21 rally from around 140p to 315p looks impressive if somewhat artificial, it representing the initial impact of Covid followed by people sat at home, spending money on improvements instead of holidays and going out. As travel restrictions eased and people gained confidence to go out, perhaps this helped explain a reduction in furniture sales.
If this represents “the new normal”, then both the chart and key fundamentals imply ScS in a fair value area after mean-reverting from 120p last October to 220p currently. Adjusting for Covid dramatics, this is consistent with a 40p to 250p range in years previous.
Consensus expects an 11.5p dividend in respect of its current year to 30 July, edging up to 11.7p in 2024. It would be covered 1.4 times by earnings per share (EPS) of around 16p, assuming net profit around £6 million this year – although expectations remain usefully cautious for 2024, where an easing below £5 million is targeted. An ongoing share buyback programme helps explain resilient EPS.
ScS Group - financial summary
Year end 30 Jul
| 2016 | 2017 | 2018 | 2019 | 2020 | 2021 | 2022 | |
| Turnover (£ million) | 317 | 333 | 313 | 317 | 255 | 311 | 332 |
| Operating margin (%) | 3.5 | 3.6 | 4.4 | 4.4 | 0.3 | 8.6 | 6.1 |
| Operating profit (£m) | 11.0 | 12.0 | 13.7 | 13.9 | 0.7 | 26.8 | 20.2 |
| Net profit (£m) | 8.7 | 9.4 | 10.7 | 11.4 | -2.2 | 19.1 | 13.6 |
| Reported earnings/share (p) | 21.3 | 22.9 | 26.9 | 27.4 | -5.8 | 50.4 | 35.0 |
| Normalised earnings/share (p) | 21.3 | 22.9 | 26.9 | 28.1 | -12.2 | 41.0 | 35.0 |
| Operating cashflow/share (p) | 26.7 | 70.0 | 43.7 | 51.2 | 150 | 99.8 | 64.4 |
| Capital expenditure/share (p) | 8.3 | 12.7 | 7.0 | 13.5 | 10.0 | 11.9 | 12.2 |
| Free cashflow/share (p) | 18.5 | 57.4 | 36.6 | 37.7 | 140 | 87.9 | 52.2 |
| Dividend/share (p) | 14.5 | 14.7 | 16.2 | 16.7 | 0.0 | 10.0 | 13.5 |
| Covered by earnings (x) | 1.5 | 1.6 | 1.7 | 1.6 | 0.0 | 5.0 | 2.6 |
| Net Debt (£m) | -16.3 | -33.6 | -41.8 | -51.8 | 54.1 | 28.4 | 35.9 |
| Net assets per share (p) | 74.0 | 83.2 | 93.2 | 107 | 67.1 | 117 | 136 |
Source: historic company REFS and company accounts
Historically, there is a strong record of free cash flow – also the latest update cites end-January cash of £77 million. Do not assume, however, a “discount to cash” market valuation - last July’s balance sheet had £57 million trade payables (versus only £6 million trade receivables), which took net asset value down to 146p a share. Intangibles represented 5% and there was no financial debt albeit £107 million lease liabilities with near £4 million finance costs taking 20% of operating profit.
ScS looks well-placed as ‘the McDonald’s of sofas’
From a company analyst perspective, it is a bit perturbing how pretty much all equities lurched down last autumn, then have rebounded. Fretting over company specifics was less use - to maximise portfolio performance – than deciding which stocks offer higher risk/reward including the likes of ASOS and JD, and weight those at times of high pessimism.
In the US, prime examples would be Meta Platforms Inc Class A (NASDAQ:META), and Tesla Inc (NASDAQ:TSLA), – both now soaring.
I shall take more notice of the Greed/Fear index, although presently it implies contrarians should be cautious.
The macro context still appears broadly positive for ScS, where unless a slump ensues, then shareholders can relax with a 5% yield. Once through any recession, the stock ought to have further upside.
The era of ultra-low mortgage rates is gone; new furniture and flooring purchases are quite easily deferred. But even if house buying consolidates at a lower level, home improvements will continue. ScS’s mid-market pitch – “forever furniture for less” looks capable of attracting ex-luxury spend to the McDonald’s of sofas.
Higher-risk balance sheet remains at DFS Furniture
I examined both furniture retailers last April, when an inverted yield curve on government bonds already predicted recession.
It was encouraging how both companies showed free cash flow per share trending substantially greater than EPS – helped by customers paying for custom designs, which are then sourced or manufactured.
With ScS at 190p and DFS Furniture DFS at 182p, I preferred the former as a “buy” – suggesting both stocks discounted material risks, unless forced to cut dividends.
But indeed, this is happening, with ScS projected to pay out 11.5p a share in respect of its 2023 year after 13.5p for July 2022. DFS is expected to reduce its dividend from 7.4p in respect of the June 2022 year, to 5.8p in 2023 – representing a 4% prospective yield with its stock at 153p.
I remain wary of DFS’s balance sheet, where last June the ratio of current assets to current liabilities was 0.3, swollen by £281 million trade payables. “Net assets” comprised nearly 200% by intangibles.
I believe this explains DFS’s relatively muted stock recovery despite a similarly positive trading update on 13 January.
With hindsight I missed market lows but continue to favour ScS for a moderately attractive risk/reward profile. Hold.
Edmond Jackson is a freelance contributor and not a direct employee of interactive investor.
These articles are provided for information purposes only. Occasionally, an opinion about whether to buy or sell a specific investment may be provided by third parties. The content is not intended to be a personal recommendation to buy or sell any financial instrument or product, or to adopt any investment strategy as it is not provided based on an assessment of your investing knowledge and experience, your financial situation or your investment objectives. The value of your investments, and the income derived from them, may go down as well as up. You may not get back all the money that you invest. The investments referred to in this article may not be suitable for all investors, and if in doubt, an investor should seek advice from a qualified investment adviser.
Full performance can be found on the company or index summary page on the interactive investor website. Simply click on the company's or index name highlighted in the article.
Disclosure
We use a combination of fundamental and technical analysis in forming our view as to the valuation and prospects of an investment. Where relevant we have set out those particular matters we think are important in the above article, but further detail can be found here.
Please note that our article on this investment should not be considered to be a regular publication.
Details of all recommendations issued by ii during the previous 12-month period can be found here.
ii adheres to a strict code of conduct. Contributors may hold shares or have other interests in companies included in these portfolios, which could create a conflict of interests. Contributors intending to write about any financial instruments in which they have an interest are required to disclose such interest to ii and in the article itself. ii will at all times consider whether such interest impairs the objectivity of the recommendation.
In addition, individuals involved in the production of investment articles are subject to a personal account dealing restriction, which prevents them from placing a transaction in the specified instrument(s) for a period before and for five working days after such publication. This is to avoid personal interests conflicting with the interests of the recipients of those investment articles.