Stockwatch: Burberry and rebirth of demand at a FTSE 250 share
As the market continues to digest the luxury goods giant’s latest profit warning, analyst Edmond Jackson assesses consumer spending trends and a business that’s confounding expectations.
16th July 2024 11:09
by Edmond Jackson from interactive investor
This week has kicked off with insight into how higher-end, discretionary consumer spending is being affected by a sluggish white-collar jobs market, yet spending on essentials is less affected. Second-quarter economic weakness in China is also to blame, hurting commodity stocks.
- Invest with ii: What is a Managed ISA? | Open a Managed ISA | Transfer an ISA
Burberry Group (LSE:BRBY) has warned on profit, cancelled its dividend and let go its CEO, just as recruiter Robert Walters (LSE:RWA) mirrored two others last week declaring a 15% drop in net fee income during the second quarter – with a deteriorating trend also. Yet ME Group International (LSE:MEGP), previously known as Photo-Me and still involved in photo booths and laundry machines, cites positive momentum.
Pressure on 20-30 somethings make for luxury goods woe
This age group – often in professional-type employment - is thought to constitute a majority of luxury goods spend, one estimate suggesting up to 80% by 2030. Partly it represents aspirational spending on image, and during the pandemic it was a pep-up while money could not be spent elsewhere. This then shifted to restaurants and travel as restrictions eased, but more recently a constrained jobs market and inflation has borne down on luxury-goods spending that is easiest to cut. Is a £450 pair of Burberry boxer shorts really necessary?
- Market snapshot: Burberry shock sends shares to 14-year low
- Sign up to our free newsletter for share, fund and trust ideas, and the latest news and analysis
Such consumers may also have run down savings and become more reliant on credit card debt just when interest rates have jumped.
It all helps explain why luxury goods spending globally is under the cosh, hence Burberry chose the wrong time to experiment with hyper-expensive new products different from its legacy brand.
The shares are very difficult to rate firmly. From the late 1980s, Bernard Arnault showed how it is possible to transform a luxury goods group – LVMH (EURONEXT:MC) – as if one person can make a huge difference. Burberry’s new CEO has a strong track record in luxury, but so, apparently, did the recent incumbent.
There is Warren Buffett’s longstanding adage about how “when a manager with a reputation for brilliance tackles a business with a reputation for bad economics, the reputation of the business remains intact.”
What exactly are Burberry's fundamentals? Is it just down to a dire macro context which may eventually pass? Are strategic mistakes ultimately fixable, but without clarity about how long they will take to mend? Buffett has famously spoken of a business’s “franchise” by which he means brand-power, but in fashion has Burberry’s halo slipped?
While the chart can imply it is too late to sell given a bidder might strike at any time, the fundamentals can imply the £3 billion company as the proverbial super-tanker to turn around.
Yes, there will be speculative rallies, like from 725p briefly to over 750p yesterday afternoon, but you can take all sorts of views on where lies intrinsic value for this stock. It is down to 720p this morning.
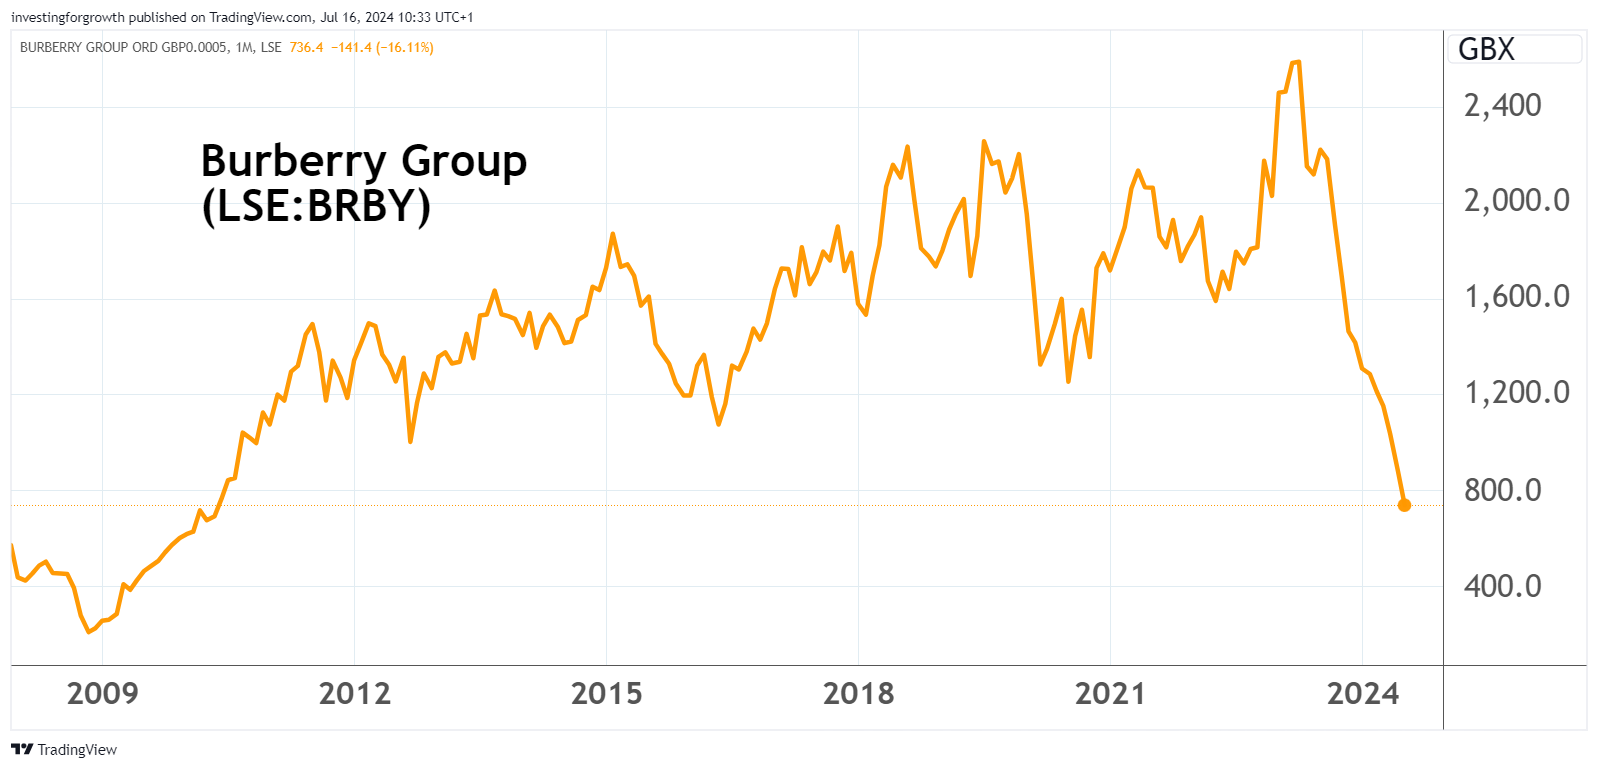
Source: TradingView. Past performance is not a guide to future performance.
A “buy” case would be that much of the bad news is priced in, and the market may start to price for recovery under a new boss. There’s also takeover potential. Against this, the consumer environment for luxury goods is liable to soften further and you would have to put faith in the market taking a new CEO’s initiatives well, before proof in the numbers.
This is also Burberry’s second profit warning this year, hence, according to the adage, there must be a third, perhaps this autumn when the new CEO seeks to establish a benchmark for his progress.
Robert Walters may be a less risky ‘buy’
Burberry has had to cancel its payout, hence you are left speculating on intangible brand values with its stock trading on around three times net tangible asset value.
What I like about quality recruitment stocks currently is chart low-points relative to past-proven ability to recover with the cycle, plus scope to lock in attractive yield backed by balance sheet cash.
Robert Walters has, like PageGroup (LSE:PAGE) and Hays (LSE:HAS) last week, declared a 15% decline in net fee income for the second quarter to 30 June. Quite similarly as PageGroup, the trend has worsened over the quarter with June down 18%.
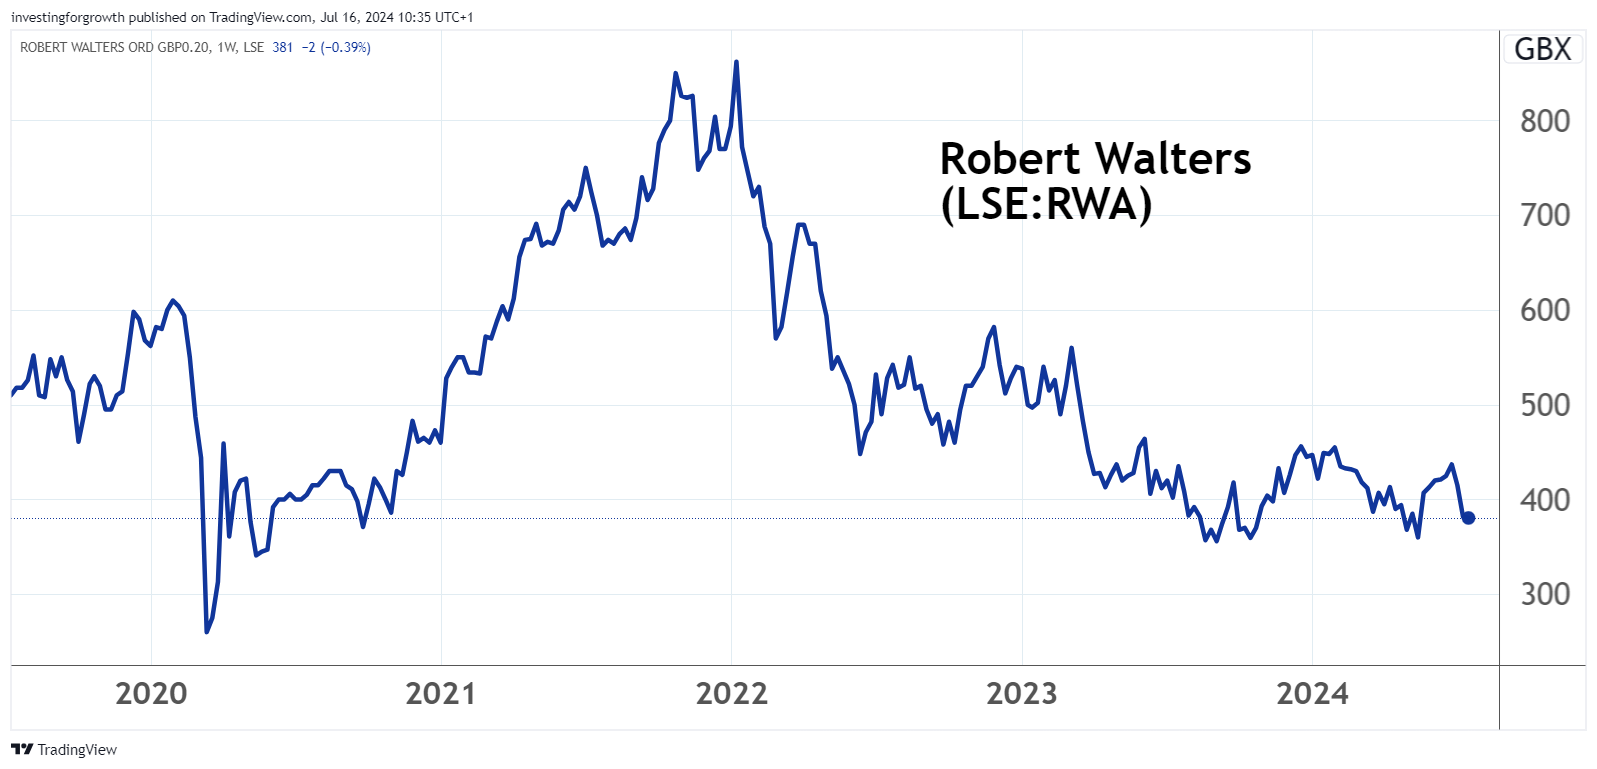
Source: TradingView. Past performance is not a guide to future performance.
Founded by Australians, Walters has an Asia-Pacific orientation, so has relatively modest US scale. However, economic turbulence and political uncertainty is holding back recruiter/candidate confidence almost everywhere. “Any material improvement in confidence levels will be gradual and likely not occur before 2025,” the company says.
Management eschews a formal profit warning but cites “a wider range of potential outcomes for the full year than seen historically”. The consensus expectation on net profit has downgraded from a 7% fall to 45% down this year, then a rebound to near £19 million in 2025. Admittedly, such agency type businesses can be operationally geared.
If trusting a 2025 earnings per share (EPS) target of 26p relative to 19p last year, at 377p the forward price/earnings (PE) multiple is mid-teens, but Walters’ history shows capability to achieve EPS over 50p and there has not been material dilution since. The cyclically adjusted PE could therefore be in single figures.
Robert Walters - financial summary
Year-end 31 Dec
| 2015 | 2016 | 2017 | 2018 | 2019 | 2020 | 2021 | 2022 | 2023 | |
| Turnover (£ million) | 813 | 999 | 1,166 | 1,233 | 1,216 | 938 | 971 | 1,100 | 1,064 |
| Operating margin (%) | 2.8 | 2.6 | 3.6 | 4.0 | 4.2 | 1.6 | 5.6 | 5.3 | 2.5 |
| Operating profit (£m) | 23.1 | 26.2 | 41.9 | 49.7 | 51.2 | 14.8 | 54.1 | 58.2 | 26.3 |
| Net profit (£m) | 15.3 | 19.9 | 29.3 | 35.6 | 34.0 | 5.7 | 33.5 | 39.1 | 13.4 |
| Reported earnings/share (p) | 18.7 | 25.4 | 38.9 | 45.8 | 44.9 | 7.5 | 43.7 | 53.4 | 19.0 |
| Normalised earnings/share (p) | 19.3 | 26.0 | 39.5 | 46.2 | 45.0 | 8.9 | 43.0 | 53.8 | 19.0 |
| Return on capital (%) | 24.7 | 25.2 | 33.9 | 32.2 | 23.3 | 6.8 | 23.7 | 23.8 | 11.5 |
| Operating cashflow/share (p) | 19.3 | 37.6 | 42.4 | 80.8 | 92.3 | 131 | 43.9 | 52.0 | 64.6 |
| Capex/share (p) | 7.3 | 6.4 | 9.3 | 8.1 | 12.6 | 13.1 | 17.2 | 21.7 | 22.6 |
| Free cashflow/share (p) | 12.0 | 31.2 | 33.1 | 72.7 | 79.7 | 118 | 26.7 | 30.3 | 42.0 |
| Dividend per share (p) | 7.1 | 8.5 | 12.0 | 14.7 | 4.5 | 15.5 | 20.4 | 23.5 | 23.5 |
| Covered by earnings (x) | 2.6 | 3.0 | 3.2 | 3.1 | 10.0 | 0.5 | 2.1 | 2.3 | 0.8 |
| Cash (£m) | 43.4 | 62.6 | 61.9 | 79.9 | 112 | 156 | 142 | 123 | 95.7 |
| Net assets per share (p) | 119 | 133 | 162 | 202 | 211 | 222 | 228 | 246 | 228 |
Source: historic company REFS and company accounts.
The table also shows a strong record of free cash flow often well in excess of earnings, hence it may not be unrealistic that consensus still expects dividend per share growth to continue despite a near-term earnings setback.
With dividend per share of 24.4p in respect of this year, rising to 26.2p in 2025, it implies a near 7% prospective yield with the stock currently around 377p. Despite being uncovered this year by earnings, yesterday’s update cited £49 million net cash (excluding leases) at end-June versus a 26p costing nearly £19 million.
In which case, buyers now may lock in a 7% yield besides capital upside potential. Expect a small-cap – Walters is capitalised around £275 million – to be priced for a better yield than a mid-cap, compensating for greater risk of variability. But it is another example why I like recruiters currently.
Strong interims from ME imply no consumer spending crisis
In photo booths and conveniently located laundry machines, MS has delivered strong interim results to 30 April. Revenue was up nearly 9% at constant currency, earnings per share up nearly 17% and operational cash flow up 19%.
The second half “has started strongly...positive momentum across operations...the board remains confident it will deliver another year of record profitability in line with market expectations”.
ME’s chart makes it look like a momentum stock, and at 180p the forward PE is around 12x, supported by a 4.6% prospective yield with 1.8x cover, as if well-backed.
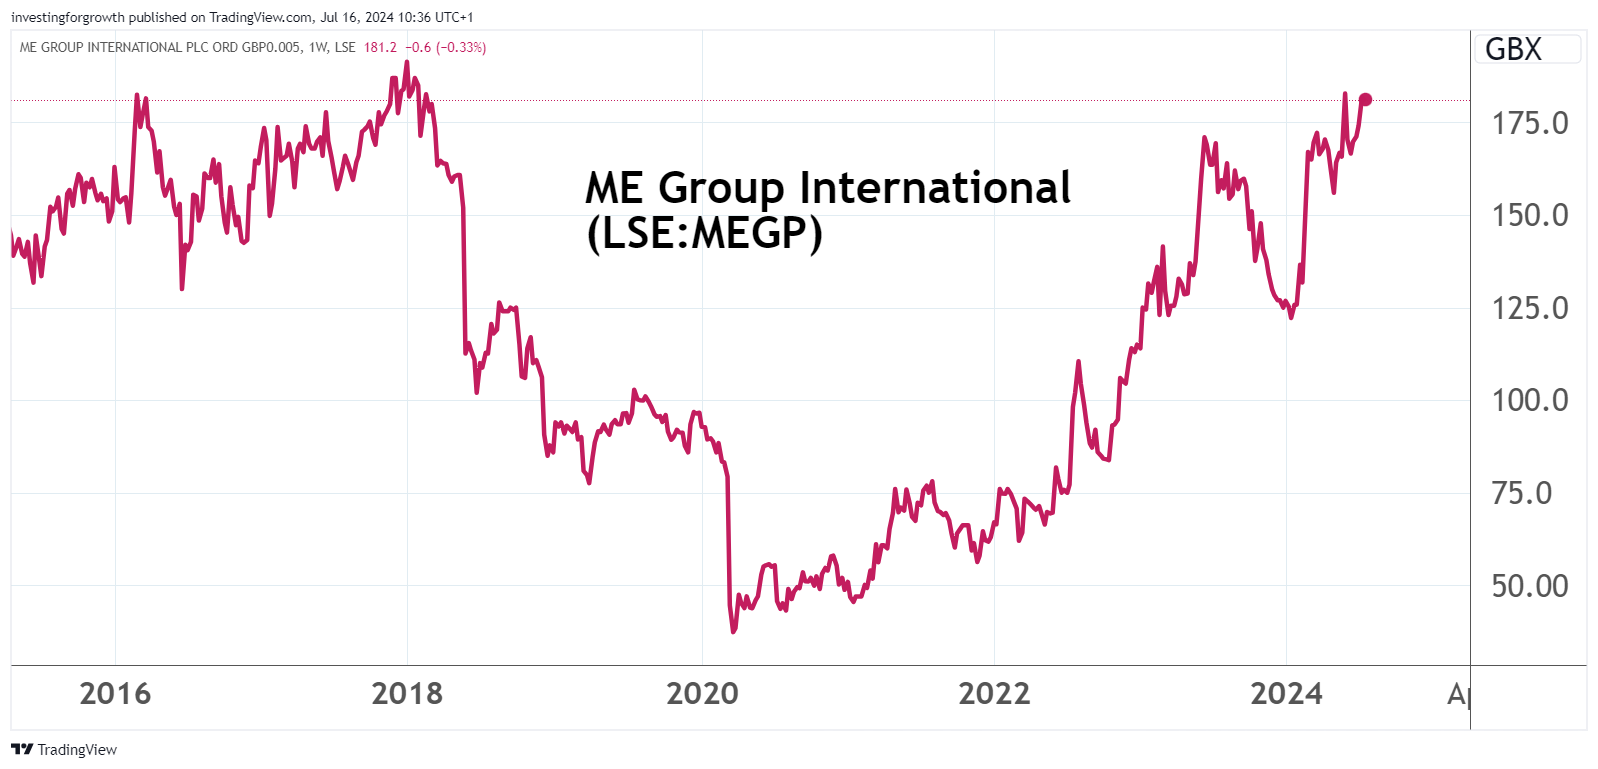
Source: TradingView. Past performance is not a guide to future performance.
There are ambitious installation targets for the laundry machines – effectively, the growth angle here – targeting 80 to 90 a month and on track to deliver a record number of installations in the second half of 2024.
In June 2021, I made a “buy” case at 83p and have since applied a strong “hold” stance, for example last February at 160p.
My problem to re-iterate “buy” at 180p is that I do not fully grasp this rebirth of demand for photo booths, nor the laundry machines in French car parks and the like.
- Shares for the future: a FTSE 250 stock in top half of my list
- The Income Investor: two FTSE 100 stocks where dividends count
Earlier this year, I renewed my passport and, yes, it is a bit of a faff to find somewhere with an off-white background, which they insist on for your photograph (with domestic interiors often more colourful). I would still have had to go out to find an ME booth.
As it happens, right now I should wash a nice down duvet before colder nights – which needs a good machine for a large load – but having read some mixed reviews about ME’s, I wouldn’t take such a risk.
I do not dispute ME’s numbers and what others find appealing, hence I stick with a “hold” rating.
Edmond Jackson is a freelance contributor and not a direct employee of interactive investor.
These articles are provided for information purposes only. Occasionally, an opinion about whether to buy or sell a specific investment may be provided by third parties. The content is not intended to be a personal recommendation to buy or sell any financial instrument or product, or to adopt any investment strategy as it is not provided based on an assessment of your investing knowledge and experience, your financial situation or your investment objectives. The value of your investments, and the income derived from them, may go down as well as up. You may not get back all the money that you invest. The investments referred to in this article may not be suitable for all investors, and if in doubt, an investor should seek advice from a qualified investment adviser.
Full performance can be found on the company or index summary page on the interactive investor website. Simply click on the company's or index name highlighted in the article.
Disclosure
We use a combination of fundamental and technical analysis in forming our view as to the valuation and prospects of an investment. Where relevant we have set out those particular matters we think are important in the above article, but further detail can be found here.
Please note that our article on this investment should not be considered to be a regular publication.
Details of all recommendations issued by ii during the previous 12-month period can be found here.
ii adheres to a strict code of conduct. Contributors may hold shares or have other interests in companies included in these portfolios, which could create a conflict of interests. Contributors intending to write about any financial instruments in which they have an interest are required to disclose such interest to ii and in the article itself. ii will at all times consider whether such interest impairs the objectivity of the recommendation.
In addition, individuals involved in the production of investment articles are subject to a personal account dealing restriction, which prevents them from placing a transaction in the specified instrument(s) for a period before and for five working days after such publication. This is to avoid personal interests conflicting with the interests of the recipients of those investment articles.