New forecast for Frasers Group shares
29th March 2023 07:34
by Alistair Strang from Trends and Targets
Its share price has quadrupled since the Covid crash low, but can the owner of Sports Direct continue to race higher? Independent analyst Alistair Strang reveals his latest predictions.

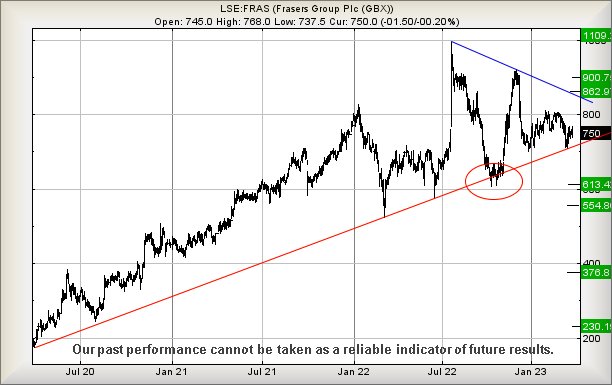
We can be a little paranoid about warning signs against share price movements. For instance, the chart below for clothing retailer Frasers Group (LSE:FRAS) displays a bit of a stunner, something which actually makes some sense when you think about it.
This sort of thing happens all the time, a solid uptrend breaking and we suspect all it implies is the potential for weakness in a price movement, essentially the market broadcasting “this trend in not sacred, it can break!”
However, should a share price move below the level of a historical ‘warning’ break of a trend, it’s definitely the time to jog along to your local Sports Direct and buy running shoes as a worst case scenario may be about to come true.
- Invest with ii: Open a Stocks & Shares ISA | ISA Investment Ideas | Transfer a Stocks & Shares ISA
As an aside, the Frasers Group of today really has nothing in common with the historical House of Fraser in Glasgow, a company formed around 170 years ago and the subject of utter dread every December in the 1970’s. For some reason, always designated as my mother's official bag carrier, spending hours in the awful place buying Christmas gifts for everyone (except me) left only a memory of the utter stink of perfume. This wasn’t a shop which generated fond memories for this particular child.
In the case of Frasers Group share price currently, the Red uptrend has been confirmed multiple times since 2020.
Should early signals for trouble be needed, share price closure below 720p looks capable of breaking Red and promoting weakness to a non threatening 613p with secondary, if broken, a rather nasty looking 554p.
As I alluded earlier, anything capable of bringing a share price below the circled Red trend break value is liable to be quite dangerous, taking the share price into a zone where a sharp reversal cycle to 376p, perhaps even a bottom of 230p becomes probable.

Source: Trends and Targets. Past performance is not a guide to future performance.
In the event Frasers Group intends an emergency escape from this troubling picture, share price movements above just 807p calculate with the chances of a lift to 862p next with secondary, if beaten, at 900p and an expectation of some hesitation.
From our perspective, the share price needs closure above 900p to suggest considerable strength has entered the fray and a future exists which may not stink!
Alistair Strang has led high-profile and "top secret" software projects since the late 1970s and won the original John Logie Baird Award for inventors and innovators. After the financial crash, he wanted to know "how it worked" with a view to mimicking existing trading formulas and predicting what was coming next. His results speak for themselves as he continually refines the methodology.
Alistair Strang is a freelance contributor and not a direct employee of Interactive Investor. All correspondence is with Alistair Strang, who for these purposes is deemed a third-party supplier. Buying, selling and investing in shares is not without risk. Market and company movement will affect your performance and you may get back less than you invest. Neither Alistair Strang or Interactive Investor will be responsible for any losses that may be incurred as a result of following a trading idea.
These articles are provided for information purposes only. Occasionally, an opinion about whether to buy or sell a specific investment may be provided by third parties. The content is not intended to be a personal recommendation to buy or sell any financial instrument or product, or to adopt any investment strategy as it is not provided based on an assessment of your investing knowledge and experience, your financial situation or your investment objectives. The value of your investments, and the income derived from them, may go down as well as up. You may not get back all the money that you invest. The investments referred to in this article may not be suitable for all investors, and if in doubt, an investor should seek advice from a qualified investment adviser.
Full performance can be found on the company or index summary page on the interactive investor website. Simply click on the company's or index name highlighted in the article.