Labour’s revival not the only one for investors to watch
Corporate activity and interest rate expectations have helped yield bumper returns in some investment trust areas, says Kepler’s Thomas McMahon.
12th July 2024 14:57

This content is provided by Kepler Trust Intelligence, an investment trust focused website for private and professional investors. Kepler Trust Intelligence is a third-party supplier and not part of interactive investor. It is provided for information only and does not constitute a personal recommendation.
Material produced by Kepler Trust Intelligence should be considered a marketing communication, and is not independent research.
We think it is fair to say the mood in the market wasn’t optimistic last October, when we claimed that it was “an exciting time for investors in the investment trust sector”. However, thanks to sheer brilliance rather than any kind of luck (of course), publication was almost perfectly timed with the beginning of a rally that has seen markets make significant gains across the board since then.
- Invest with ii: Top Investment Trusts | Cashback Offers | Open a Trading Account
We published this articleon 23 October 2023, and from that day to the end of June the MSCI ACWI gained 21.5% (in sterling terms). The Nasdaq led the way, but even the poor old FTSE gained 14.6%.
We did highlight the value in the NAVs of investment trusts, but the real aim of the article was to highlight the value in the shares. We argued that corporate activity had started to heat up and this was creating opportunities for investors to achieve significant gains, before we even considered the potential in the NAVs themselves.
This corporate activity has started to make headway against the near-record average level of discounts in the sector last October. The chart below is pilfered from our original article, and shows the sector’s average discount over the previous 12 months.
INVESTMENT TRUST AVERAGE DISCOUNT
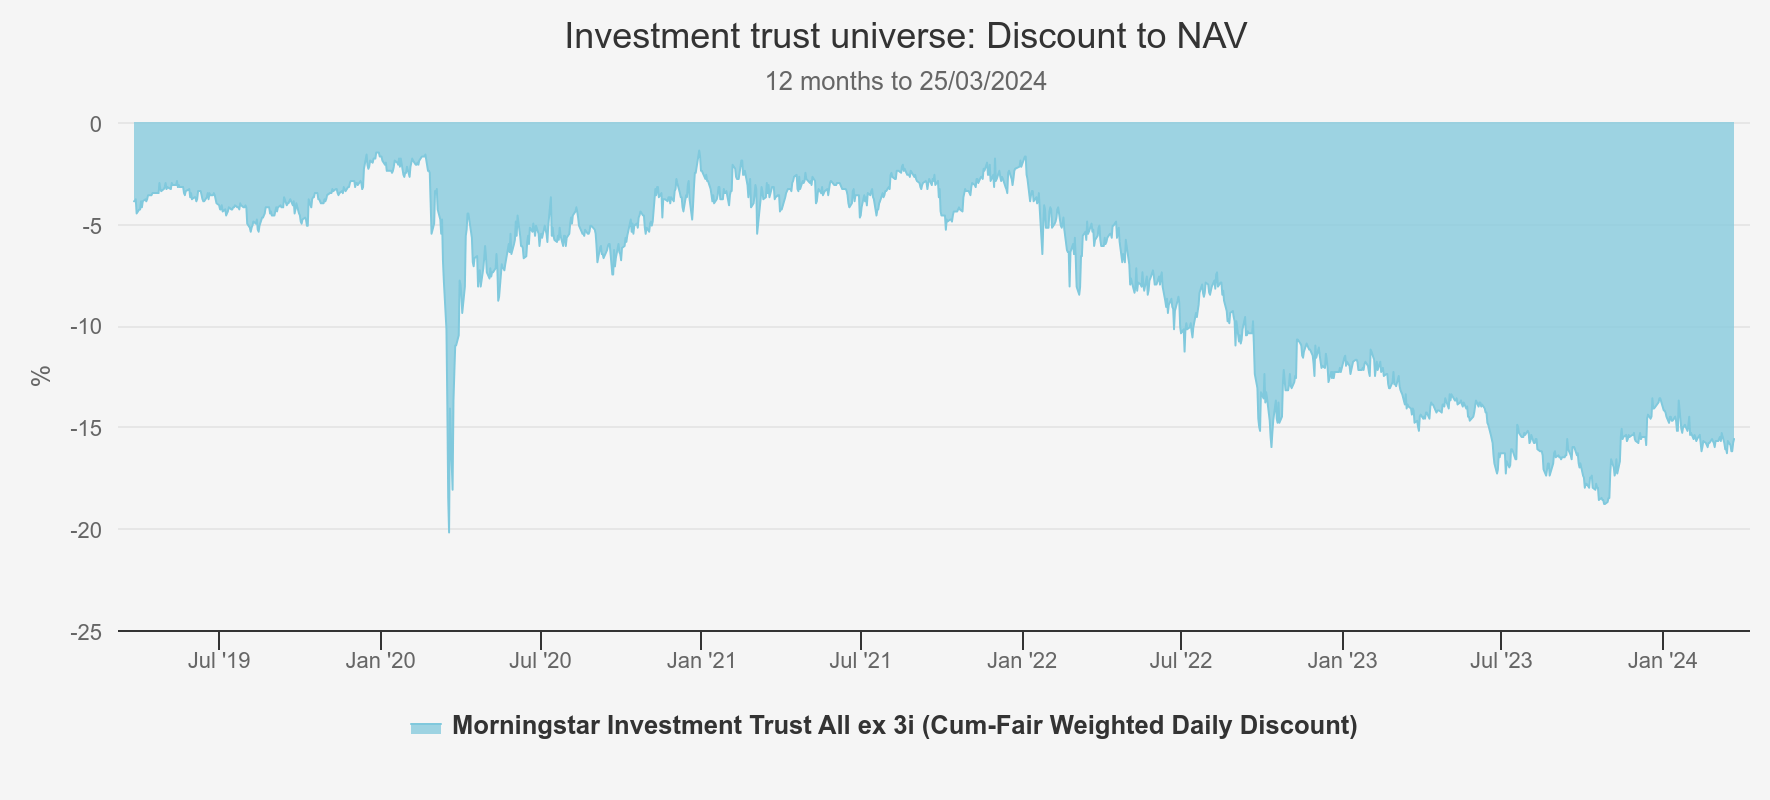
Source: Morningstar
The following chart shows the movement in the average discount since then. Note, we have adjusted the y-axis scale on this one to make the chart prettier, but the direction of travel is clear: the average discount has come in from over 19% to circa 15%, and this during a period in which NAVs have risen significantly.
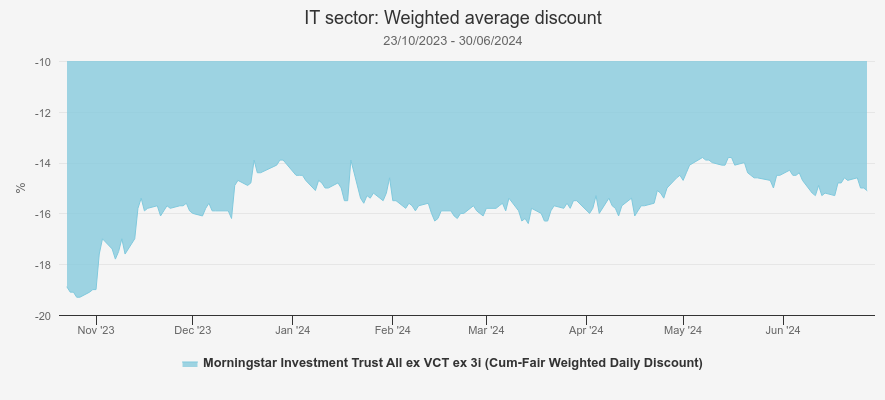
Source: Morningstar
Looking at the top level doesn’t show us much though, as the sector is highly diverse. In the table below, we show the 20 sectors with the largest average share price moves over the period (we have used weighted averages as is the convention). There are lots of interesting points analytically.
One thing that stands out is that two of the largest share price moves are entirely down to corporate activity and have come without much, if any, NAV movement at all. The 41.6% return to the Royalties sector comes from the bidding war for Hipgnosis Songs Ord (LSE:SONG). This resulted from some decisive activity by a refreshed board, incentivised by shareholders to maximise value in the shortest time possible. Not all shareholders will be in the black on this one, as the likely final price of $1.31 a share is below the all-time highs. However, those who bought on a discount will mostly have made money, and some will have made significant gains. AVI Global Trust Ord (LSE:AGT)was one such shareholder.
Similarly, the 31.8% gains to the Farmland & Forestry sector (another sector of one trust) are due to the takeover bid for Foresight Sustainable Forestry Ord (LSE:FSF)by a related party to the manager. While these two situations were very different, they both illustrate that when discounts are wide for technical or structural reasons, corporate activity can deliver exceptional returns to investors hunting for value.
TOP 20 SECTORS BY SHARE PRICE RETURNS
| NAV TR (CUMULATIVE) | SP RETURN (CUMULATIVE) | |
| Morningstar Investment Trust Royalties | 0.1 | 41.6 |
| Morningstar Investment Trust Financials & Financial Innovation | 10.4 | 35.6 |
| Morningstar Investment Trust Farmland & Forestry | 0.0 | 31.8 |
| Morningstar Investment Trust Growth Capital | 2.8 | 29.0 |
| Morningstar Investment Trust Biotechnology & Healthcare | 13.9 | 27.7 |
| Morningstar Investment Trust European Smaller Companies | 24.9 | 27.6 |
| Morningstar Investment Trust Global | 24.0 | 27.4 |
| Morningstar Investment Trust Property Securities | 25.9 | 27.3 |
| Morningstar Investment Trust UK All Companies | 24.4 | 27.2 |
| Morningstar Investment Trust North America | 19.7 | 26.6 |
| Morningstar Investment Trust Commodities & Natural Resources | 8.9 | 24.5 |
| Morningstar Investment Trust Europe | 22.7 | 24.3 |
| Morningstar Investment Trust UK Smaller Companies | 24.2 | 22.0 |
| Morningstar Investment Trust Global Smaller Companies | 16.0 | 21.0 |
| Morningstar Investment Trust Leasing | 6.1 | 21.0 |
| Morningstar Investment Trust Asia Pacific Equity Income | 16.4 | 19.0 |
| Morningstar Investment Trust North American Smaller Companies | 15.2 | 17.6 |
| Morningstar Investment Trust Asia Pacific | 18.1 | 17.6 |
| Morningstar Investment Trust Global Equity Income | 24.4 | 17.6 |
| Morningstar Investment Trust Infrastructure Securities | 14.9 | 17.4 |
Source: Morningstar. Past performance is not a reliable indicator of future results
The Financials & Financial Innovation and Growth Capital sectors have also delivered exceptional returns and gains well ahead of those reported in the NAVs. Rather than corporate activity, this seems to be more about the changing rate environment. In the first case, the returns are mainly due to a 39% increase in the share price of Augmentum Fintech Ord (LSE:AUGM), while in the second case there have been large share price gains across the sector. The two largest trusts, Petershill Partners Ord (LSE:PHLL) and Schiehallion Fund Ord (LSE:MNTN) have both seen a significant re-rating, while Seraphim Space Investment Trust Ord (LSE:SSIT) has seen its share price rise by over 60%.
In our view, the gains in these sectors have come from a change in investor sentiment towards unlisted investments. Expectations of rate cuts have relieved pressures on financing and on valuation expectations. Rising public markets will also have reduced fears that private investments hadn’t been marked down to reflect lower public valuations too. Investors who took advantage of the wide discounts on offer last year are already sitting on handsome gains (SSIT is up over 120% over 12 months), but discounts remain wide.
For example, AUGM shares are on a 28% discount to NAV and PHLL 42%. On the other hand, MNTN’s discount has come in markedly to 15% at the time of writing. As a reminder of how the maths works, a 28% discount to NAV would deliver a share price gain of 39% were it to close to par, and a 42% discount would deliver gains of 72% if it closed.
In the light of the changing rates environment, one notable feature of the above table is the sectors that haven’t barked yet – Infrastructure and Renewable Infrastructure. High-quality, relatively defensive portfolios such as those of HICL Infrastructure PLC Ord (LSE:HICL), and Sequoia Economic Infrastructure Inc (LSE:SEQI)sit on wide discounts: 22.5% and 16.4% in these cases.
The average discount in the Renewable Energy Infrastructure sector is 25%, and while there are some portfolios with assets in construction, even well-established sector leaders such asGreencoat UK Wind (LSE:UKW)or Renewables Infrastructure Grp (LSE:TRIG)are trading on double-digit discounts: 17% and 25% in these cases. We think these sectors represent real value in the scenario where interest rates are cut.
Some of the gains from corporate activity aren’t incorporated in the share price returns reported, in particular those that come from tender offers. We have seen some significant tenders made in recent months, in some cases under pressure from activist investors. For example, European Opportunities Trust (LSE:EOT) bought back 25% of its shares from investors under a tender offer in January. If you had bought shares on 12/10/2023 when the offer was first announced, on 29/01/2024 you would have received a gain of 14% on the shares you tendered compared to 9.7% on those you hadn’t. Fidelity Emerging Markets (LSE:FEML) has also conducted a large tender offer during the period. If you had bought shares on 27/11/2023 when the offer was announced, you would have received a return of 22.7% on any shares tendered compared to 11.1% on those not tendered (as of the calculation date of 22/03/2024). Only 15% of the shares were able to be tendered in this case.
Buybacks have also been impressive, and most notably Scottish Mortgage Ord (LSE:SMT)has embarked on a record programme, announcing it would commit £1 billion to repurchasing shares in March. The trust bought £311 million shares in one single day in March, and over £500 million in the second quarter.
According to the AIC, it looks likely that a record amount of cash will be spent on buybacks this year, with Winterflood recording that buybacks in the first five months were up 129% on last year, to total £3 billion. The most recorded in a calendar year was £3.9 billion, in 2023. Along with SMT, Smithson Investment Trust Ord (LSE:SSON), Finsbury Growth & Income Ord (LSE:FGT)and Monks Ord (LSE:MNKS) have bought back significant numbers of shares.
Corporate activity isn’t always about immediate gratification. The sorts of decisions we have been discussing so far are those that lead to relatively quick re-ratings or at least a quick boost to shareholder returns. The current market environment may be sharpening the focus of boards on what their long-term proposition is. In our view, one of the attractive features of the investment trust space is that it is highly competitive and ultimately quite ruthless. It is very much in the interest of shareholders for boards to be proactive in adjusting strategies and management contracts.
The merger ofAlliance Trust Ord (LSE:ATST)andWitan Ord (LSE:WTAN)has won plenty of column inches in recent weeks, and in our view reflects this competitive nature in that a manager which has performed exceptionally well is being rewarded with a fresh pool of capital. ATST has a sophisticated spin on the multi-manager approach, with Willis Towers Watson managing its portfolio with an approach it has honed for institutional investors in private mandates (see our latest note for more details on that).
The trust has delivered NAV total returns ahead of the MSCI ACWI benchmark through a period in which markets have been driven by gyrating macro-factors and latterly in which a small handful of stocks have driven markets higher, in both cases creating a difficult environment for active management. The merger will create a more liquid vehicle, boosting it into the FTSE 100, and should open it up as an option to larger investors, potentially creating a virtuous circle of rising liquidity and falling costs.
JPMorgan Global Growth & Income Ord (LSE:JGGI)is another trust to be gathering assets thanks to its success. The trust has absorbed three other ITs in mergers, which has helped swell its assets to north of £2.8 billion. The trust continues to issue shares to meet demand, and trades on a small premium at the time of writing, while the rest of the sector languishes on a discount.
This is another case of the winner taking all (which is very much in keeping with the culture of broader equity markets these days), as JGGI is by some way the top-performing trust in its Global Equity Income sector over five years and by some way ahead of all trusts in the Global sector over the same time period.
JGGI’s combination with MATE completed in March, and was one of six mergers in the first half of 2024. According to the AIC, this is already a record for a calendar year, with the previous highest number being five, seen in 2021 and in 2022. We think there is certainly a Darwinian theme to the deals we have seen so far, with weaker performers being merged into stronger performers, such as abrdn China being merged into Fidelity China Special Ord (LSE:FCSS), or boards taking some tough decisions on what strategies are likely to be most successful in future, such as the merger of generalist UK Commercial Property REIT into logistics specialist Tritax Big Box Ord (LSE:BBOX).
Gaining scale is another aim of mergers, and this seems to be the main aim of the merging of JPMorgan UK Smaller Companies and JPMorgan Mid Cap into JPMorgan UK Small Cap Growth & Income (LSE:JUGI), which completed in February. JUGI is the result of a merger of two portfolios run by the same two managers, now focused only on small-caps, and has circa £544 million in total assets.
In our view, Georgina and Katen have a good track record of generating returns when the market is right, and the portfolio is an attractive, liquid way to invest in small-caps for any recovery we hope to see over the coming years. We think it is notable that in the table above, the UK small-cap sector has delivered strong NAV total returns but is one of the few sectors where these have outstripped share price returns, i.e. discounts have not narrowed on average.
We think this presents opportunity, particularly as the decisive election result may lead to investors re-rating UK equities, as political stability seems assured for the foreseeable future.
Another feature of the new trust JUGI is the dividend policy, which sees 4% of the previous year’s NAV paid out as a dividend in equal quarterly instalments and paid from capital as necessary. This combination of growth potential and income generation has proven to be popular in recent years – JGGI being a prime proponent – and this is leading to a number of boards switching to the strategy.
One recent example is Schroder Japan Trust Ord (LSE:SJG). SJG has performed well in recent years, and is ahead of the TOPIX Index over one-, three- and five-year time frames, but continues to trade on a discount of close to 10%. The board clearly hopes that the enhanced dividend policy will bring new buyers to the trust, which should now appeal to both growth and income investors alike. It has also committed to a conditional tender offer in three years, offering investors the chance to receive a portion of their investment close to NAV if performance disappoints. In our view this all adds to the attractions of the trust, which already has a strategy well suited to the current market in Japan. We think this is a good place to be overweight right now, given the significance of the current corporate governance reform programme.
Another merger to seek to gain scale is that of Henderson European Focus Trust Ord (LSE:HET)and Henderson EuroTrust (HNE), the shareholders of which last week agreed to merge the two trusts to form Henderson European Trust (HET). HET will have net assets of circa £680 million, which means it is likely to join the FTSE 250 with all the liquidity that brings.
As is the case with almost all mergers, the deal came along with a reduction in costs and the opportunity to tender shares, both of which add value to shareholders. Both trusts had outperformed their benchmarks when the deal was announced, and the new trust will be co-managed by the managers of the predecessor trusts.
Conclusion
In conclusion, in 2024 we have already seen a record number of mergers, and we are on track to see a record amount spent on share buybacks. Meanwhile NAVs have rallied, and share prices rallied further, driven by some exceptional gains for those trusts that were trading at the widest discounts and those that have seen decisive corporate actions. Looking ahead, we see more of the same.
Once rates actually do come down, we would expect the rally in the NAVs and the share prices of risky assets and alternative assets to get a boost, while we think we have certainly not seen the end of corporate action either.
It remains an exciting time to invest in ITs, and when we spoke to Nick Greenwood and Charlotte Cuthbertson of MIGO Opportunities Trust Ord (LSE:MIGO) recently, they told us there were so many opportunities out there they couldn’t fit them all in their portfolio (we have published a new note on the trust this week).
MIGO could be a good option for the discerning investor who doesn’t want to do the work of tracking all these complicated individual situations, as could its new stablemate AVI Global Trust Ord (LSE:AGT), although AGT’s portfolio is broader than just trusts. Both do look for value opportunities in the investment trust space though, and we think this remains a great market for just this sort of strategy.
Kepler Partners is a third-party supplier and not part of interactive investor. Neither Kepler Partners or interactive investor will be responsible for any losses that may be incurred as a result of a trading idea.
These articles are provided for information purposes only. Occasionally, an opinion about whether to buy or sell a specific investment may be provided by third parties. The content is not intended to be a personal recommendation to buy or sell any financial instrument or product, or to adopt any investment strategy as it is not provided based on an assessment of your investing knowledge and experience, your financial situation or your investment objectives. The value of your investments, and the income derived from them, may go down as well as up. You may not get back all the money that you invest. The investments referred to in this article may not be suitable for all investors, and if in doubt, an investor should seek advice from a qualified investment adviser.
Full performance can be found on the company or index summary page on the interactive investor website. Simply click on the company's or index name highlighted in the article.
Important Information
Kepler Partners is not authorised to make recommendations to Retail Clients. This report is based on factual information only, and is solely for information purposes only and any views contained in it must not be construed as investment or tax advice or a recommendation to buy, sell or take any action in relation to any investment.
This report has been issued by Kepler Partners LLP solely for information purposes only and the views contained in it must not be construed as investment or tax advice or a recommendation to buy, sell or take any action in relation to any investment. If you are unclear about any of the information on this website or its suitability for you, please contact your financial or tax adviser, or an independent financial or tax adviser before making any investment or financial decisions.
The information provided on this website is not intended for distribution to, or use by, any person or entity in any jurisdiction or country where such distribution or use would be contrary to law or regulation or which would subject Kepler Partners LLP to any registration requirement within such jurisdiction or country. Persons who access this information are required to inform themselves and to comply with any such restrictions. In particular, this website is exclusively for non-US Persons. The information in this website is not for distribution to and does not constitute an offer to sell or the solicitation of any offer to buy any securities in the United States of America to or for the benefit of US Persons.
This is a marketing document, should be considered non-independent research and is subject to the rules in COBS 12.3 relating to such research. It has not been prepared in accordance with legal requirements designed to promote the independence of investment research.
No representation or warranty, express or implied, is given by any person as to the accuracy or completeness of the information and no responsibility or liability is accepted for the accuracy or sufficiency of any of the information, for any errors, omissions or misstatements, negligent or otherwise. Any views and opinions, whilst given in good faith, are subject to change without notice.
This is not an official confirmation of terms and is not to be taken as advice to take any action in relation to any investment mentioned herein. Any prices or quotations contained herein are indicative only.
Kepler Partners LLP (including its partners, employees and representatives) or a connected person may have positions in or options on the securities detailed in this report, and may buy, sell or offer to purchase or sell such securities from time to time, but will at all times be subject to restrictions imposed by the firm's internal rules. A copy of the firm's conflict of interest policy is available on request.
Past performance is not necessarily a guide to the future. The value of investments can fall as well as rise and you may get back less than you invested when you decide to sell your investments. It is strongly recommended that Independent financial advice should be taken before entering into any financial transaction.
PLEASE SEE ALSO OUR TERMS AND CONDITIONS
Kepler Partners LLP is a limited liability partnership registered in England and Wales at 9/10 Savile Row, London W1S 3PF with registered number OC334771.
Kepler Partners LLP is authorised and regulated by the Financial Conduct Authority.