ii investment performance review: Q3 2024
The Federal Reserve started its rate-cutting cycle in the third quarter, following in the footsteps of the European and UK central banks.
15th October 2024 09:01

Market round-up
Global equity returns were modest (0.47%) in sterling terms for Q3 despite stints of market volatility, with global bonds faring better having risen 0.82%. In early August, equities were thumped by a coalescence of an interest rate hike by the Bank of Japan culminating in the unwinding of the popular yen carry trade, and indications of a softening US economy feeding into fears of a recession.
- Invest with ii: What is a Managed ISA? | Open a Managed ISA | Transfer an ISA
Although global equities recovered swiftly, they quickly took another downturn in early September as a slowing US labour market was confirmed and investors once again raised concerns that the valuations of companies involved in the AI theme exceeded expectations of what they can deliver.
In response to a slowing US economy, the Federal Reserve started its rate-cutting cycle with a 50-basis point (bps) cut to its target rate from 5.25–5.50% to 4.75–5.00%, following the likes of the European Central Bank, which delivered its second rate cut in September and the Bank of England, which commenced its own rate-cut programme in August.
Elsewhere, China’s recent economic struggles have been well documented, with a flagging real estate sector, faltering consumer spending and geopolitical tensions, all of which have battered valuations. To boost the fortunes of its spluttering economy, the People’s Bank of China announced a stimulus package that included a cut in the central bank’s seven-day reverse repo rate by 20bps to 1.50%, a 50-basis point cut to reserve requirement ratios (RRR), (essentially the amount of cash a bank must hold) to increase liquidity, with scope for further RRR cuts later in the year.
Mortgage payers also saw support with a 50bps reduction on existing mortgages and the minimum deposit ratio for second home buyers lowered to 15%, down from 25%. For the stock market, the central bank announced it will provide liquidity support and plans for a market stabilisation fund.
While the long-term effects of the stimulus are unknown, Chinese markets soared, with equities seeing double-digit gains in the week following the announcement.
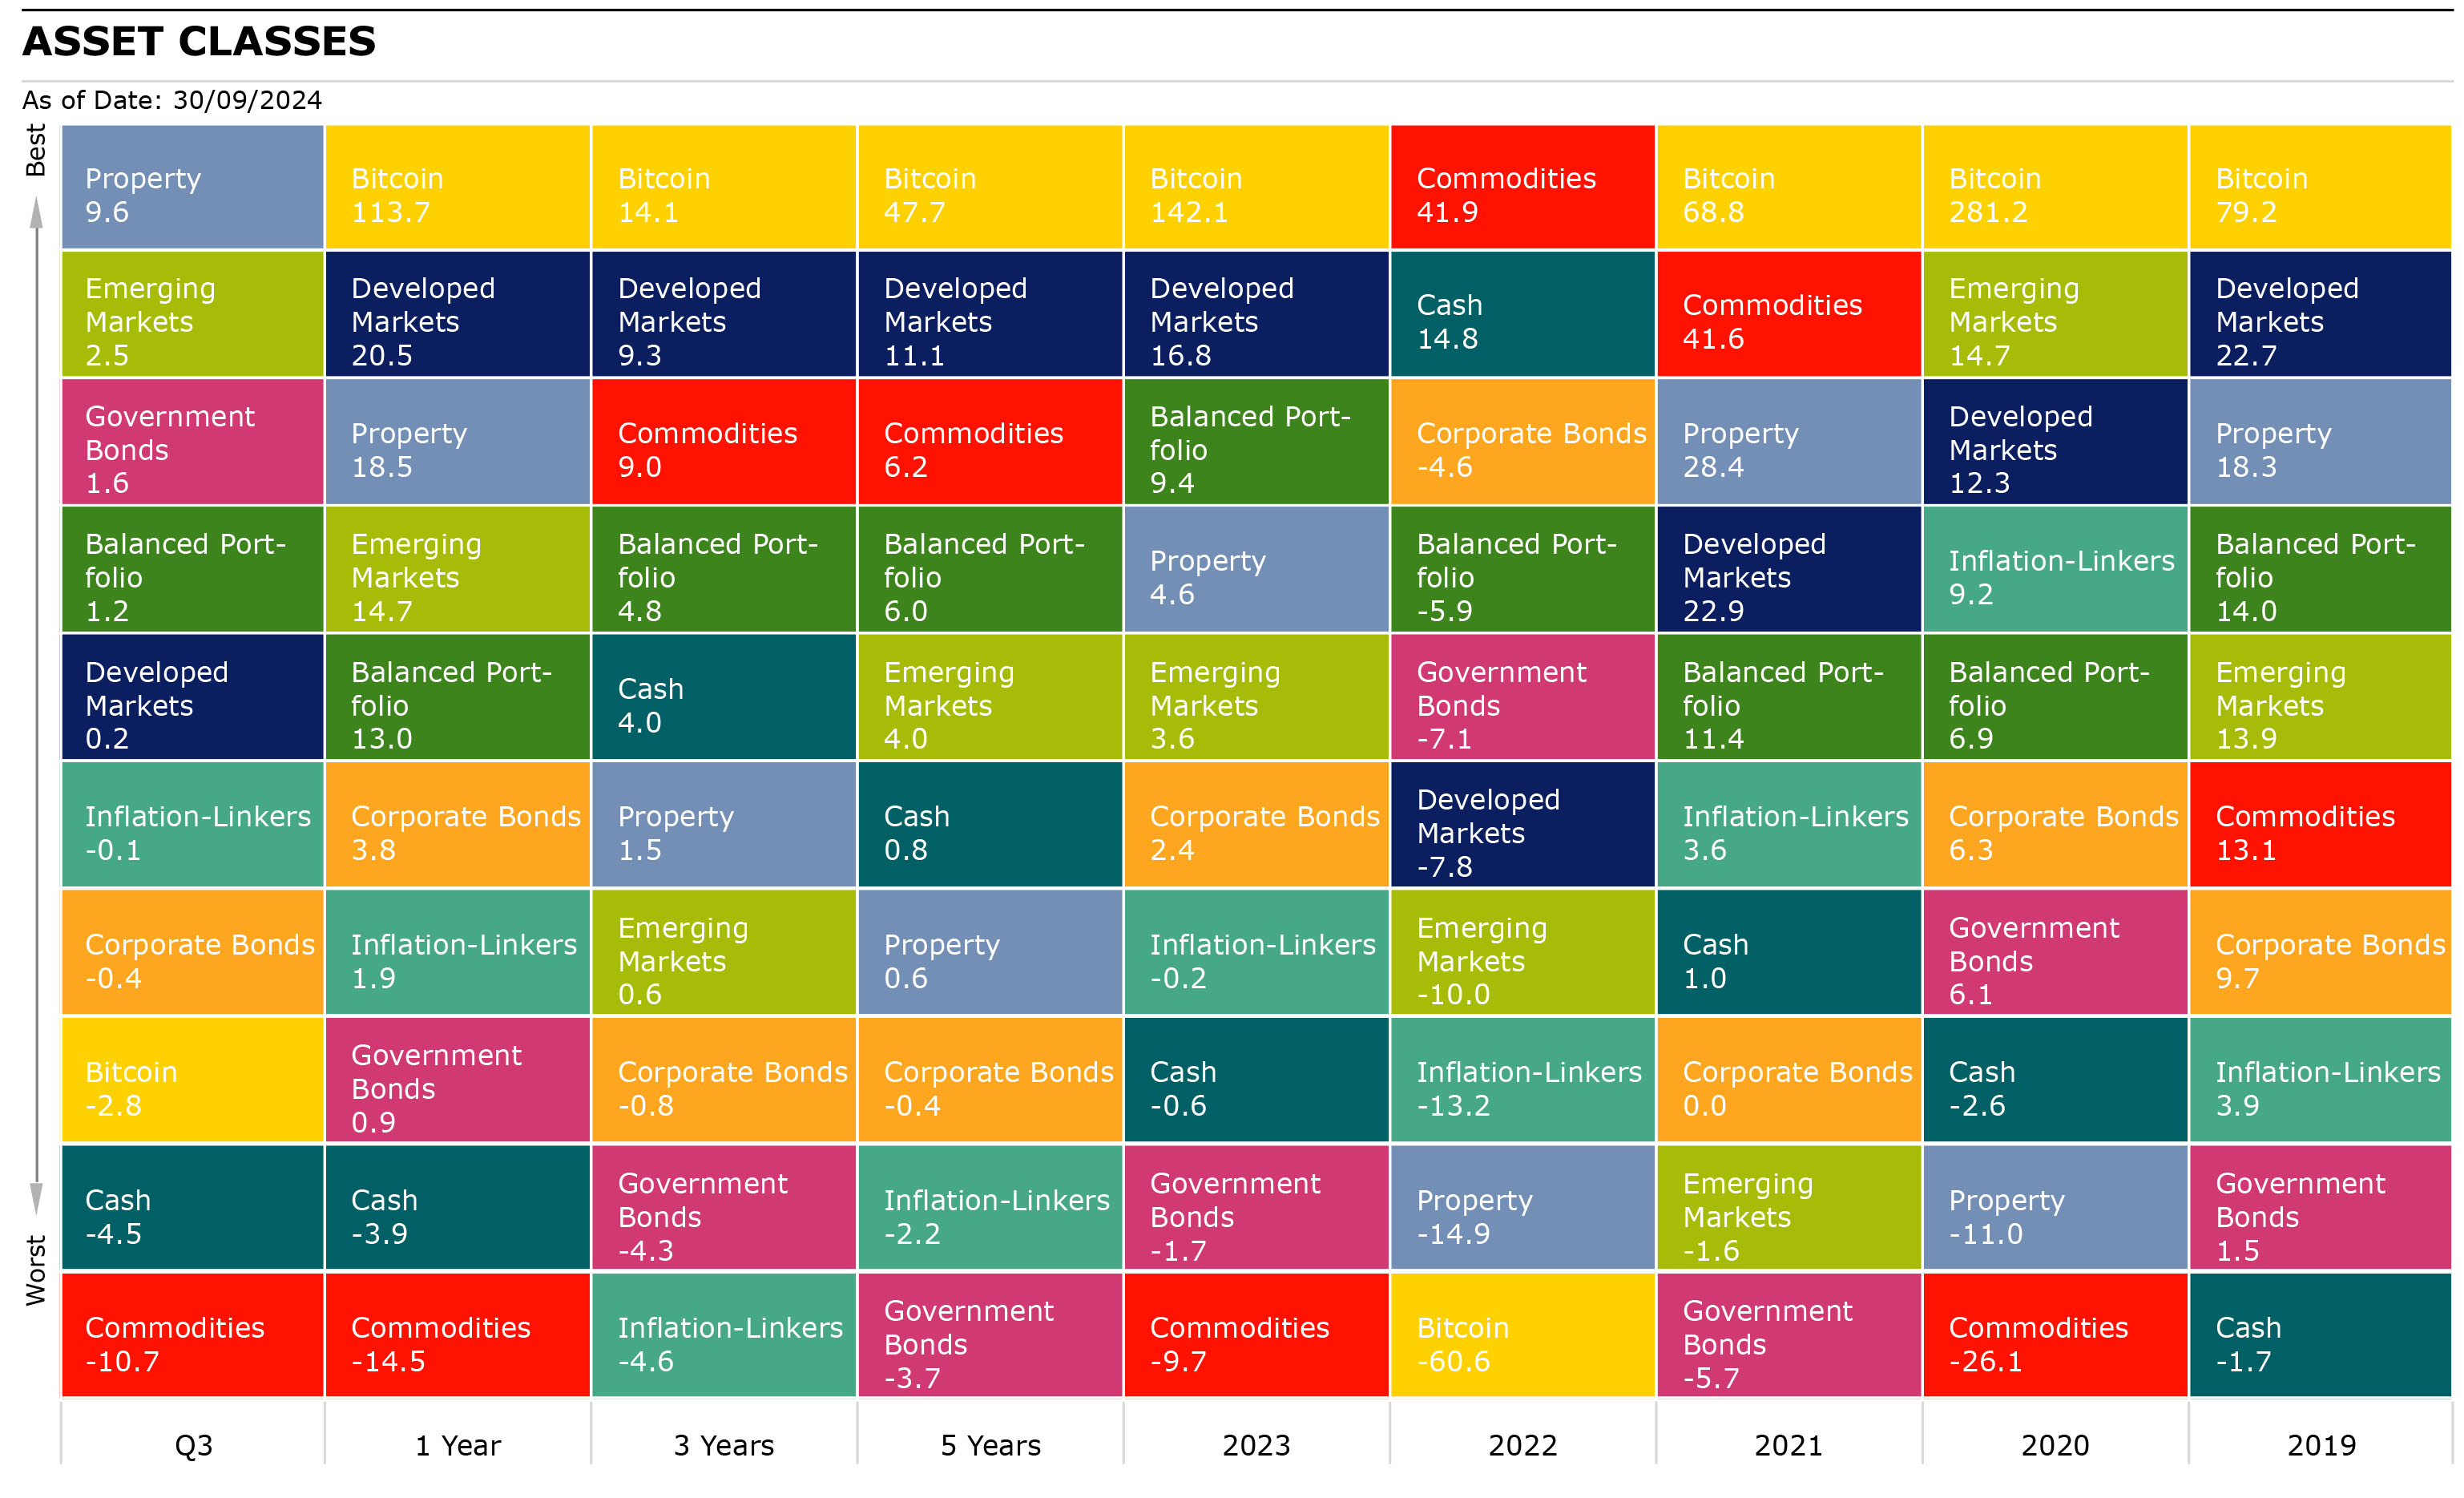
Source: Morningstar as of 30th September 2024. Total Returns in GBP. Developed Markets: MSCI World, Emerging Markets: MSCI EM, Corporate Bonds: Bloomberg Global Aggregate Corporate, Commodities: S&P GSCI, Property: FTSE EPRA Nareit Developed, Inflation-Linkers: Bloomberg Global Inflation Linked, Government Bonds: Bloomberg Global Treasury, Bitcoin: MarketVector Bitcoin, Balanced Portfolio: FTSE UK Private Investor Balanced, Cash: ICE LIBOR 1 Month.
Shares
Global equity returns, as measured by the MSCI ACWI, were modest over Q3 returning 0.47%. Emerging markets (EM) outperformed developed markets (DM) having risen 2.46% versus 0.24% for DM.
UK equities outperformed the global index as the FTSE All-Share rose 2.26% over the period with utilities (10.98%), consumer staples (9.86%) and telecoms (6.67%) being the leading contributors, while energy (-14.46%) was the biggest detractor, with healthcare (-1.27%) and IT (-0.60%) also seeing negative returns.
As alluded to in the previous section, US equities saw elevated levels of turbulence over the quarter, with the S&P 500 closing the quarter 0.21% lower. The best-performing sectors were utilities (12.1%), real estate (10.2%) and industrials (5%) with the largest detractors being energy (-8.2%), IT (-4.3%) and communications (-4.3%). The latter two sectors reflect the sell-off among technology-related names as investors began to reassess the true impact of AI and the often-stratospheric valuations associated with it.
European equities closed the quarter flat having returned 0.07% with the leading contributors being utilities (10.9%), communications (6.2%) and financials (5.1%), and the largest detractors being IT (-12.2%), energy (-8.7%) and consumer discretionary (-2.8%).
- Sign up to our free newsletter for share, fund and trust ideas, and the latest news and analysis
- Your money and Labour’s first 100 days in power
In Japan, the Topix index increased modestly, at 0.79% for the period after also experiencing increased volatility due to the Bank of Japan increasing interest rates, which resulted in the unwinding of the yen carry trade and reverberated through global markets. As the yen strengthened, Japanese equities suffered as the recent stock market rally in Japan had been driven by Japan’s exporters, which benefited from a weak yen; this all culminated in the biggest single-day decline since Black Monday.
Despite market volatility, corporate earnings remained strong and macroeconomic figures showed solid progress. Over Q3, the best performers in Japan were retail trade (14.2%), transportation & logistics (9.3%), and construction and materials (8.7%), with auto & transportation equipment (-12%), banks (-7.5%) and power & gas (-4.3%) being the biggest relative underperformers.
EM equities rose 2.46% over the quarter, driven by positive returns predominately in China (16.4%), which is a large EM constituent, as the announcement of a stimulus package by Chinese policymakers was welcomed by the market. Elsewhere, Thailand (21.5%), the Philippines (14.7%) and Malaysia (13.6%) also outperformed significantly, while Turkey (-17.6%), South Korea (-11%) and Poland (-9.4%) were the main laggards.
From a sector perspective, consumer discretionary (17.8%) led all EM sectors, followed by healthcare (15.8%) and communications (9%), with IT (-8.2%) and energy (-6.1%) being the main detractors.
| Q3 | 1 year | 3 years | 5 years | |
| FTSE All-Share | 2.26 | 13.40 | 7.41 | 5.74 |
| FTSE 100 | 1.83 | 12.39 | 9.15 | 5.96 |
| FTSE 250 | 4.66 | 19.11 | 0.08 | 3.82 |
| FTSE Small Cap | 4.24 | 18.21 | 1.09 | 8.20 |
| Europe Ex UK | 0.07 | 14.49 | 5.91 | 7.41 |
| S&P 500 | -0.21 | 24.07 | 12.11 | 14.03 |
| Asia-Pacific Ex Japan | 4.20 | 17.70 | 1.96 | 5.11 |
| TOPIX Japan | 0.79 | 10.66 | 3.28 | 5.46 |
| Emerging Markets | 2.46 | 14.70 | 0.58 | 3.97 |
| Brazil | 0.97 | -6.60 | 7.45 | -1.53 |
| China | 16.38 | 12.73 | -5.39 | -0.86 |
| India | 1.11 | 27.70 | 11.84 | 14.50 |
| World | 0.24 | 20.50 | 9.27 | 11.14 |
| MSCI ACWI | 0.47 | 19.89 | 8.28 | 10.30 |
| World Growth | -2.49 | 25.11 | 8.55 | 13.98 |
| World Value | 3.12 | 15.46 | 8.68 | 7.21 |
Source: Morningstar as of 30 September 2024. Total Returns in GBP. MSCI ACWI World Indexes. Past performance is not a guide to future performance.
Sectors/Style
Stylistically, global value outperformed global growth as it rose 3.1% over the quarter, while growth declined by -2.5%.
From a global sector perspective, the best performer was utilities which rose 9.9% in Q3 and is the third-best performing sector on a year-to-date basis, behind IT and communications. The utilities sector is considered a bond proxy due to its stable dividends and has benefited from interest rate cuts which lowered treasury yields, increasing the desirability of the sector for income investors.
Utilities also benefited from investors seeking to de-risk as economic conditions decline. Meanwhile, energy (-8%), IT (-4.7%) and communications (-1.7%) were the only sectors that saw negative returns. Energy suffered as Brent crude fell 17.3% in the period as demand weakened and with Saudi Arabia seemingly preparing to increase output. IT and communications lagged as investors begin to reassess their expectations for AI and its impact.
Having struggled in recent times, mid and small-cap stocks rose 3.5% and 2.5% respectively outperforming large-caps, which returned a meagre -0.06% this quarter.
| Q3 | 1 year | 3 years | 5 years | |
| Consumer Discretionary | 3.07 | 14.03 | 2.34 | 8.29 |
| Healthcare | 0.10 | 9.95 | 5.96 | 9.36 |
| Industrials | 4.03 | 22.59 | 10.43 | 10.20 |
| Information Technology | -4.71 | 34.99 | 14.13 | 20.71 |
| Materials | 3.35 | 9.84 | 4.92 | 8.38 |
| Utilities | 9.86 | 23.51 | 9.13 | 4.72 |
| Consumer Staples | 3.10 | 7.48 | 5.33 | 3.97 |
| Financials | 4.30 | 23.95 | 9.35 | 8.60 |
| Energy | -8.03 | -7.76 | 18.44 | 7.94 |
| Communication Services | -1.71 | 24.91 | 3.34 | 8.66 |
Source: Morningstar as of 30 September 2024. Total Returns in GBP. MSCI ACWI World Indexes. Past performance is not a guide to future performance.
Fixed income
The Bloomberg Global Aggregate Index rose 0.82% this quarter as numerous major economies began their rate-cutting cycles as signs of economic weakness emerge and confidence that inflation has been reined in. The Bank of England began its own rate-cutting cycle with a 25bps cut to its base rate to 5.00% in August, and the Federal Reserve delivered a 50bps rate cut in September, bringing its target range to 4.75–5.00%. Meanwhile, the ECB delivered its second 25bps cut of the cycle in September with its rate currently standing at 3.50%.
Over the quarter, the US 2-year yield fell from 4.77% to 3.65% and the US 10-year yield also fell, from 4.41% to 3.88%. In the UK, the 2-year yield fell from 4.22% to 4% and the 10-year yield fell from 4.18% to 4.01%. In Germany, 2-year yield fell from 2.83% to 2.07% and 10-year yield fell from 2.49% to 2.13%.
Global treasuries (1.59%) outperformed global corporates (-0.42%) as treasuries saw an outsized benefit due to their sensitivity to interest rate changes relative to corporates. However, this was not the case in the US as US corporates declined by 0.26%, while US government bonds fell 1.32% and, in the UK, gilts (2.32%) and corporates (2.28%) were comparable. Global high yield (0.09%) underperformed against its investment grade (IG) counterpart due to IG’s higher sensitivity to rate changes.
| Q3 | 1 year | 3 years | 5 years | |
| Global Aggregate | 0.82 | 1.90 | -2.89 | -2.50 |
| Global Government | 1.59 | 0.90 | -4.26 | -3.74 |
| UK Gilts | 2.32 | 7.86 | -6.90 | -4.91 |
| Global Corporate | -0.42 | 3.77 | -0.81 | -0.41 |
| Sterling Corporate | 2.28 | 9.73 | -2.86 | -1.04 |
| EURO Corporate | 1.33 | 5.06 | -2.53 | -1.74 |
| Global Inflation Linked | -0.14 | 1.94 | -4.60 | -2.22 |
| UK Inflation Linked | 1.49 | 6.32 | -12.46 | -7.55 |
| Global High Yield | 0.09 | 8.26 | 2.88 | 2.31 |
Source: Morningstar as of 30 September 2024. Total Returns in GBP. Global Aggregate: Bloomberg Global Aggregate, Global Government: Bloomberg Global Treasury, UK Gilts: FTSE Act UK Conventional Gilts All Stocks. Global Corporate: Bloomberg Global Corporate, Sterling Corporate: ICE BofA Sterling Non-Gilt, Euro Corporate: Markit iBoxx EUR, Global High Yield: Bloomberg Global High Yield, Global Inflation Linked: Bloomberg Global Inflation Linked, UK Inflation Linked: Bloomberg Global Inflation Linked UK. Past performance is not a guide to future performance.
Alternatives
The S&P GSCI fell 10.72% during the quarter with all commodities sectors recording negative returns, bar precious metals which rose 5.9%, with gold rising 7.3% within this sector.
The biggest detractor was energy, which fell 17.3%, as did Brent crude, which also fell 17.3% during this time due to weakening demand and with Saudi Arabia seemingly ready to abandon its unofficial target of $100 per barrel and increase output, potentially causing an oversupply. There are concerns of further volatility to oil prices given the escalating tensions in the Middle East which could impact global supply.
| Q3 | 1 year | 3 years | 5 years | |
| Global REITs | 9.63 | 18.47 | 1.55 | 0.65 |
| UK REITs | 6.04 | 23.08 | -4.64 | -0.98 |
| Gold | 7.30 | 28.85 | 15.46 | 10.36 |
| Global Infrastructure | 6.90 | 19.14 | 9.77 | 5.07 |
| Global Natural Resources | -2.41 | -2.04 | 8.78 | 8.65 |
| Volatility | 26.74 | -13.11 | -10.09 | -1.10 |
| Cash | -4.47 | -3.85 | 4.01 | 0.78 |
| Commodity | -10.72 | -14.52 | 9.00 | 6.22 |
| Brent Crude Oil | -17.29 | -19.06 | 12.79 | 9.60 |
| Energy | -17.29 | -22.55 | 11.03 | 4.06 |
| Bitcoin | -2.76 | 113.72 | 14.10 | 47.69 |
Source: Morningstar as of 30th September 2024. Total Returns in GBP. Global REITS: FTSE EPRA Nareit Developed, UK REITs: FTSE EPRA Nareit UK, Gold: LBMA Gold Price AM, Oil: Oil Price Brent Crude, Global Infrastructure: S&P Global Infrastructure, Natural Resources: S&P Global Natural Resources, Commodities: S&P GSCI , Energy : S&P GSCI,Volatility: CBOE Market Volatility (VIX), Cash: ICE LIBOR 1 Month, Bitcoin: MarketVector Bitcoin. Past performance is not a guide to future performance.
Most-traded shares on the ii platform in Q3 2024
Most-bought shares
| NVIDIA Corp (NASDAQ:NVDA) |
| BP (LSE:BP.) |
| Legal & General Group (LSE:LGEN) |
| Helium One Global Ltd Ordinary Shares (LSE:HE1) |
| Rolls-Royce Holdings (LSE:RR.) |
Most-sold shares
These articles are provided for information purposes only. Occasionally, an opinion about whether to buy or sell a specific investment may be provided by third parties. The content is not intended to be a personal recommendation to buy or sell any financial instrument or product, or to adopt any investment strategy as it is not provided based on an assessment of your investing knowledge and experience, your financial situation or your investment objectives. The value of your investments, and the income derived from them, may go down as well as up. You may not get back all the money that you invest. The investments referred to in this article may not be suitable for all investors, and if in doubt, an investor should seek advice from a qualified investment adviser.
Full performance can be found on the company or index summary page on the interactive investor website. Simply click on the company's or index name highlighted in the article.