High returns and low volatility from this little-known fund
Saltydog Investor looks at funds investing in financial companies to reveal a star performer.
17th September 2024 09:40
by Douglas Chadwick from ii contributor

This content is provided by Saltydog Investor. It is a third-party supplier and not part of interactive investor. It is provided for information only and does not constitute a personal recommendation.
Over the past couple of months, we have seen the overall level of volatility increase in stock markets around the world.
This has been particularly pronounced in the Japanese Nikkei 225 and the Nasdaq. There was also a significant spike in the VIX at the beginning of August.
- Invest with ii: What is a Managed ISA? | Open a Managed ISA | Transfer an ISA
The CBOE Volatility Index (VIX) is designed to measure investors’ expectations of the near-term stability of the US stock market. It is produced by the Chicago Board Options Exchange and is a barometer of the market's anticipated volatility over the next 30 days.
It is calculated using a complex formula based on the prices of S&P 500 index options. This means that it reflects market sentiment rather than actual stock price movements. It is often referred to as the “fear index” because it tends to rise during times of market stress or uncertainty.
Typically, the VIX hovers between 10 and 20 during periods of low volatility, which is where it has been for most of 2024. Since 1 January, it has averaged just under 15 and, until the end of July, it had only exceeded 20 once. On 19 April, it opened at 21.3, peaked at 21.4, but closed the day at 18.7.
- How fund managers are investing ahead of US election
- Sign up to our free newsletter for investment ideas, latest news and award-winning analysis
That all changed at the beginning of August. On Friday 2 August, the VIX rose back above 20. The following Monday, it opened at 23.4, briefly spiked above 65, before closing at 38.6. This was its highest level since the early days of the pandemic in 2020. It dropped down to around 16 in the second half of August, but has gone back above 20 several times this month. It looks as though investors are sensing that there may be trouble ahead.
We have also seen this coming through in our regular sector analysis. When we were reviewing our reports last week, the UK bond sectors had all gone up in the previous week and were all showing gains over the past four weeks. Although stocks tend to outperform bonds in the long run, bonds tend to be less volatile and can give greater returns in the short term.
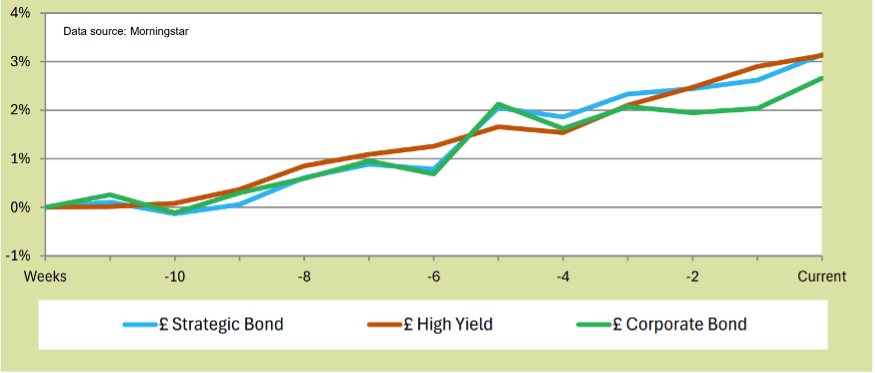
Past performance is not a guide to future performance.
At the same time, the UK Equity sectors had all fallen in the previous week. The UK Equity Income and the UK All Companies sectors were still showing gains over four weeks, but the UK Smaller Companies sector had gone down. However, over 12 weeks you can see that they had been much more volatile than the UK Bond sectors.
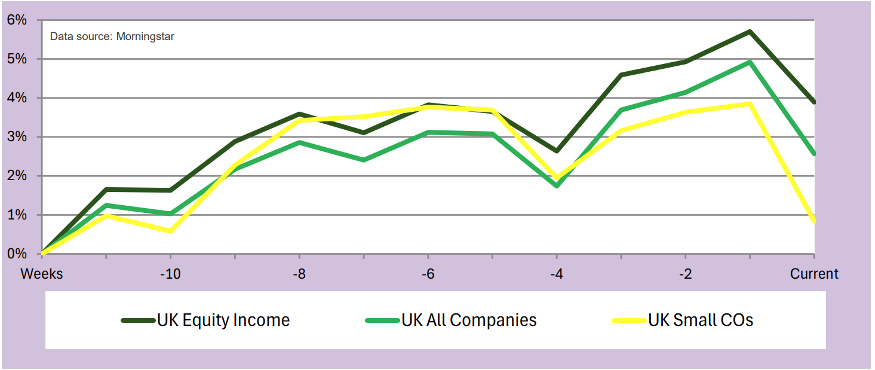
Past performance is not a guide to future performance.
The swings in the overseas markets have been even more severe. Last week, the Japan sector was showing a four-week gain of 4.4%, but it had dropped 5.4% in the four weeks before that. The combined America and American Smaller Companies sectors were down 0.8% over four weeks, adding to a loss of 2.8% in the previous four weeks. The China/Greater China sector had fallen by 4.1% over four weeks and 8.1% over eight weeks.
The Technology and Technology Innovations sector, which has often been the best-performing sector, had lost 2.4% in four weeks and 12.3% in eight weeks. It just goes to show that although sometimes the most volatile sectors produce the biggest gains, they can also suffer the largest losses.
When the mainstream sectors are struggling, we sometimes see some of the funds from the more niche sectors coming through. Most of the funds in these sectors used to be in the ‘Specialist’ sector, which acted like a catch-all for the funds that did not naturally fit anywhere else. However, in 2021, the Investment Association (IA) introduced six new sectors: Financials and Financial Innovation, Healthcare, Infrastructure, Commodities/Natural Resources, Latin America, and India/Indian Subcontinent.
- Top-performing fund, investment trust and ETF data: September 2024
- Can you own just one fund? The answer might surprise you
Over the past couple of years, I have written about the funds investing in India several times. We hold the Jupiter India fund in our demonstration portfolios, and it has gone up by over 50% since we went into it at the end of August last year.
The best-performing sector this August was Healthcare, with a one-month return of 2%, followed by Financials and Financial Innovation, which was up 1.5%. In the past couple of weeks, the Financial and Financial Innovation sector has edged ahead.
We monitor six funds from the Financial and Financial Innovation sector, and last week they were all posting four-week gains. At the top of our analysis, based on its latest decile rankings, was Polar Capital Global Insurance fund. This fund was launched in December 1998 and is by far the largest of the six funds, with a portfolio value of over £2 billion.
The fund invests in “the shares of companies that are involved in various sectors of the insurance industry. These may include general insurance, reinsurance, life assurance, insurance brokerages and support service companies”. Next up was Jupiter Financial Opportunities and then Jupiter Global Financial Innovation.
Here is a graph showing their performance so far this year.
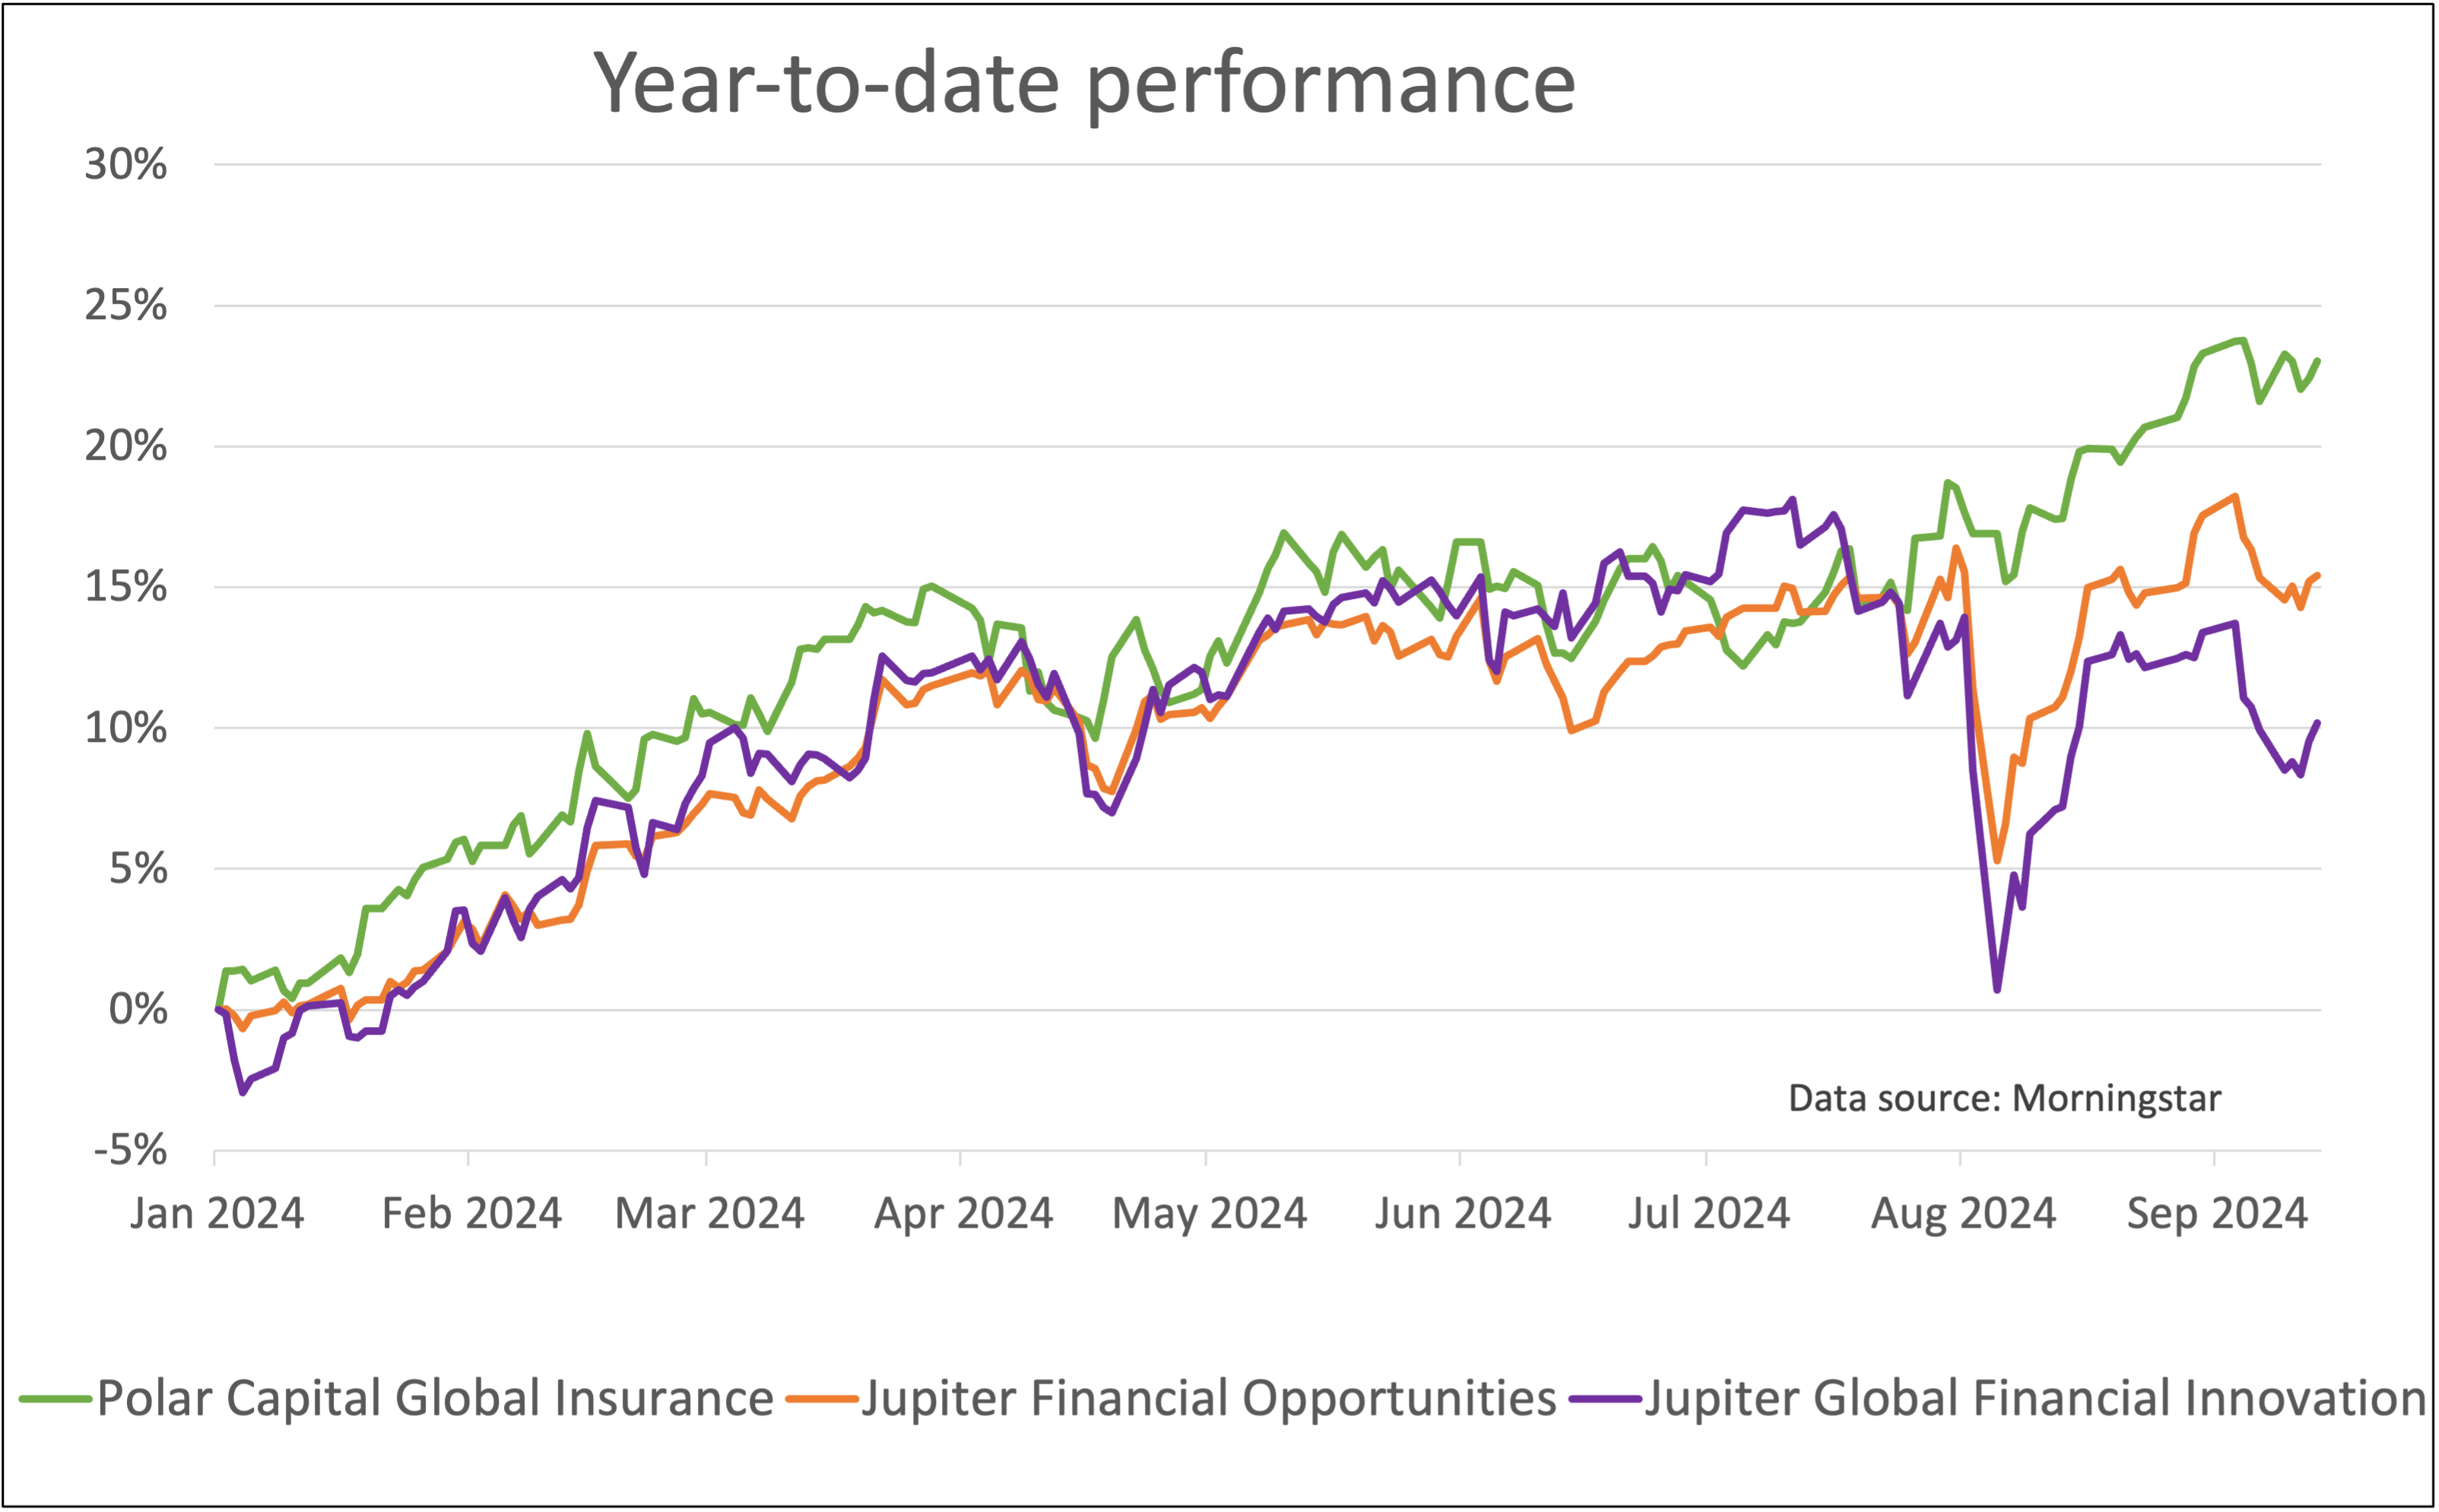
Past performance is not a guide to future performance.
It is very clear that the Jupiter funds fell dramatically at the beginning of August, in line with global stock markets. The Polar Capital Global Insurance fund also went down but not by as much, and quickly recovered, soon reaching new highs.
Over the year, the Polar Capital fund has been less volatile than the other two and has achieved greater returns.
At Saltydog Investor we are constantly on the lookout for funds producing healthy returns, but without too much volatility. This is a fund that we will definitely be keeping an eye on.
For more information about Saltydog, or to take the two-month free trial, go to www.saltydoginvestor.com
These articles are provided for information purposes only. Occasionally, an opinion about whether to buy or sell a specific investment may be provided by third parties. The content is not intended to be a personal recommendation to buy or sell any financial instrument or product, or to adopt any investment strategy as it is not provided based on an assessment of your investing knowledge and experience, your financial situation or your investment objectives. The value of your investments, and the income derived from them, may go down as well as up. You may not get back all the money that you invest. The investments referred to in this article may not be suitable for all investors, and if in doubt, an investor should seek advice from a qualified investment adviser.
Full performance can be found on the company or index summary page on the interactive investor website. Simply click on the company's or index name highlighted in the article.