Goldman’s bear market indicator is urging you to be cautious
Here’s how the investment bank hunts for signs of trouble, and what its latest findings mean for your portfolio.
12th July 2024 09:10
by Stéphane Renevier from Finimize
- Goldman Sachs's research finds that six key things typically precede a bear market: high stock valuations, a flat yield curve, robust manufacturing activity, overspending in the private sector, rising core inflation, and very low unemployment rates.
- Goldman, essentially, pulls all those factors into a single indicator by ranking each one against its historical performance (in other words, calculating its “percentile rank”) and averaging them out. This provides a composite score that gauges the likelihood of an oncoming bear market.
- Right now, the indicator is above 70% – a level that time and time again has been a cue for investors to brace for potential turbulence.
With stocks hitting dizzying new heights and valuations looking stretched, the talk about a possible dip is getting louder. To cut through the noise (which is more often about investor jitters than solid data), I dove into the Goldman Sachs playbook for predicting bear markets. Its approach uses hardcore indicators to call out the real signs of trouble, helping to sort the legitimate warnings from mere market chatter.
What’s Goldman’s methodology, then?
First, a quick definition: a bear market is what happens when an index falls 20% from its peak, a knock that’s often significant enough to turn things pessimistic for a while.
Now, spotting a bear market before it hits is notoriously tricky: each one is triggered by different factors and no single indicator consistently gets it right. In trying to crack the code, Goldman Sachs tracked historical patterns. It dove into over 40 different economic, market, and technical indicators – the most revealing of which are highlighted in the chart below – but it found that no single indicator was the holy grail.
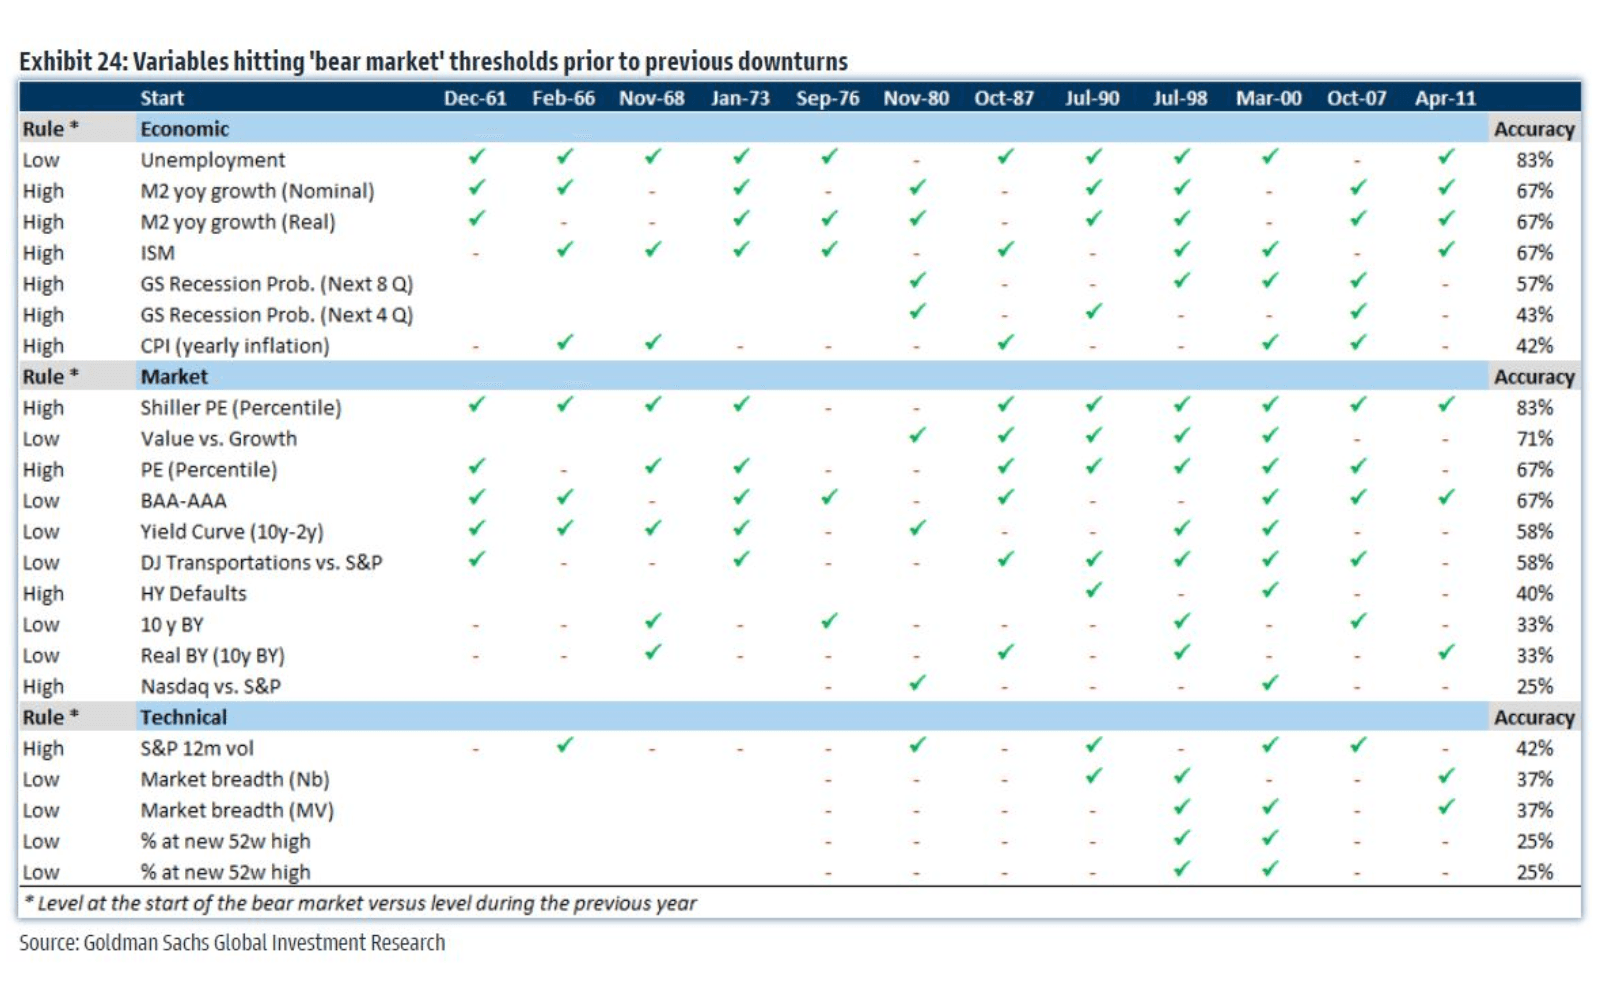
Individual indicators had varying degrees of success in predicting past bear markets. Source: Goldman Sachs (2017)
Instead, Goldman found that a combo of specific variables tended to move in sync as a bear market looms. Tracking them together doesn’t always give a perfect prediction, but it does provide a helpful heads-up, flagging the risk levels well before the market tips.
The investment bank’s research found that the most common two features of bear markets are deteriorating growth momentum and rising interest rates (or other market-unfriendly moves from central banks) at a time of high stock valuations.
But, in total, six factors tend to play a big role, time and time again:
Stock valuations. High valuations don’t typically trigger market falls on their own, but they do signal market fragility. So Goldman keeps an eye on the Shiller price-to-earnings (P/E) ratio for the S&P 500 and flags higher valuations as a caution sign. The higher they climb, the gloomier the forecast, signaling there’s less wiggle room if other indicators start to slide.
The yield curve. When the yield curve flattens – i.e. when the shorter-dated Treasury bonds deliver as much yield as their long-dated cousins – it suggests that central banks are hiking interest rates to slow down the economy. More often than not, those types of moves push the economy into a recession. Goldman gauges the state of the curve by comparing the yields of newly issued 18-month Treasuries to the ones that are maturing now. The more negative the “spread” or difference, the more bearish the vibe.
US manufacturing activity. Interestingly, better manufacturing activity, which suggests economic strength, can actually foretell market downturns. That’s because the biggest drops in activity (as measured by the purchasing managers index, or PMI) tend to happen after a peak, and stock investors are forward-looking, so they anticipate those drops. When the economy is still hot but about to cool, that’s when risks are at their highest.
Private sector financial balance. This indicator measures financial health by comparing income to spending across US households and firms. When spending outpaces income, it’s a red flag, signaling that economic growth is unsustainable, and that stocks are about to turn.
Core inflation. High inflation across the “core” measure – which excludes more volatile consumer prices like energy and food, tends to trigger interest rate hikes, which historically have been bad for economic growth and stock returns. It also tends to have a big impact on consumer spending and economic growth, and can lead to lower stock valuations because of the shrunken purchasing power of the cash flows that companies generate.
Unemployment. Like with high manufacturing activity, superlow unemployment might seem like good news, but often it’s just hinting at market risks ahead. The jobless rate tends to react slowly to changes across the economy, after all, so when it hits a level that’s just as low as it can go, that typically signals an end to the good times. Plus, when jobs are plentiful and everyone’s feeling bullish, that often primes the pump for a big overreaction when things start to shift.
Goldman, essentially, pulls all those factors into a single indicator by ranking each one against its historical performance (i.e. calculates its “percentile rank”) and averaging them out. This provides a composite score that gauges the likelihood of a bear market. Historically, a score above 70% has been a cue for investors to brace for potential turbulence, while a score below 40% suggests a buying opportunity.
As you can see in the chart below, its performance isn’t perfect, but it did correctly predict many bear markets (blue areas) and their recoveries.
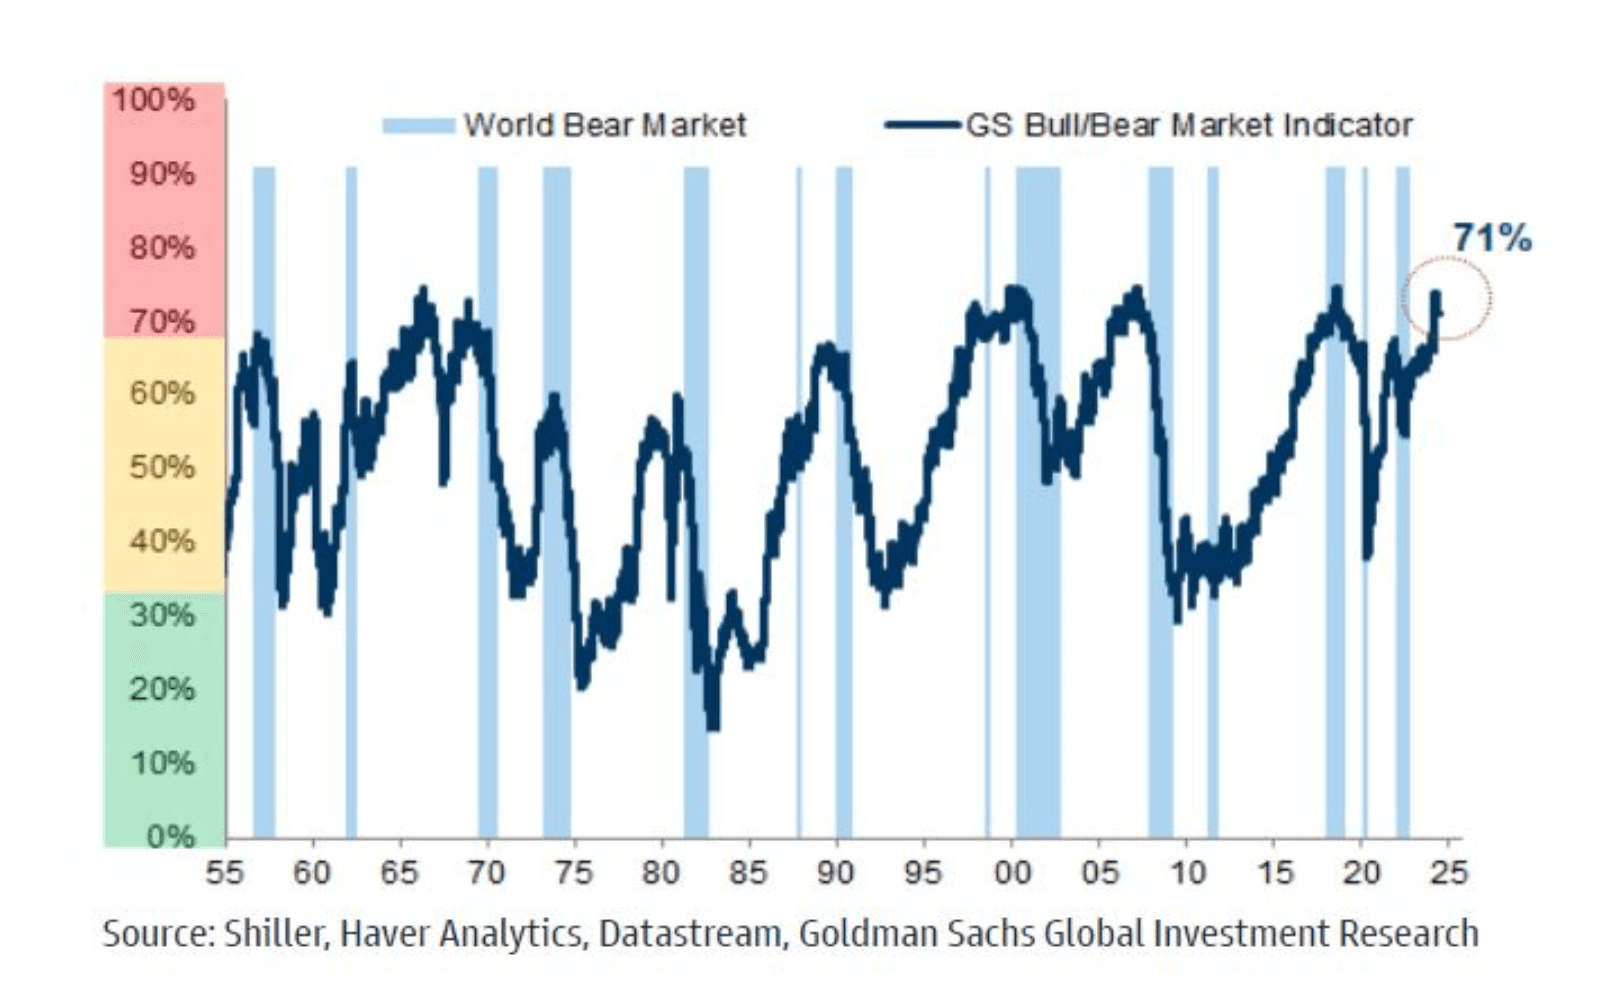
The Goldman Sachs bull/bear market indicator, dark blue line. Actual bear market periods are shaded in light blue, Source: Goldman Sachs.
So, what does this indicator say now?
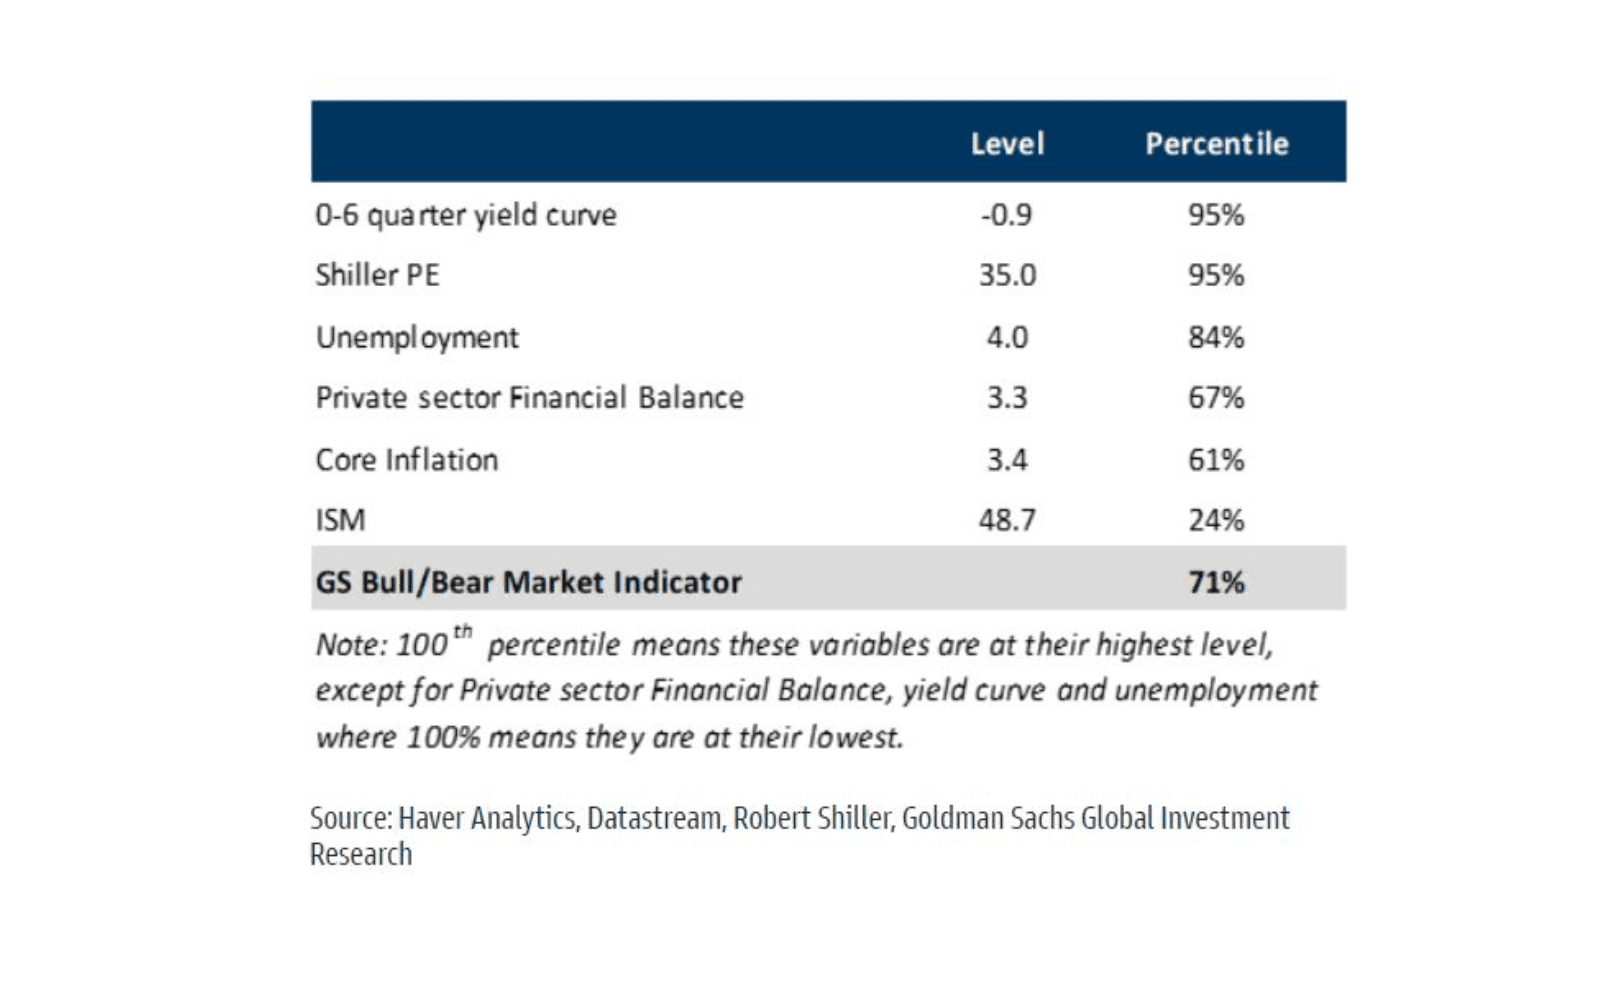
It just breached 70% – a level that preceded many of the previous significant bear markets. And that’s mostly driven by extremely lofty stock valuations (highest 5% of its history), extremely low unemployment (lowest 5% of its history), and how inverted the yield curve is (in only 16% of its history has it been more inverted than this).
Private sector financial balances and elevated inflation aren’t at extreme levels but they do point to challenges for household consumption and the economy. As for the only “bright spot”, it comes from the already weak manufacturing activity .
The Goldman Sachs bull/bear market indicator recently breached 70% – a level that preceded many significant bear markets. Source: Goldman Sachs.
When Goldman first ran its analysis in 2017, the researchers found that levels above 70% indicated a higher probability of a significant stocks move lower (drawdown) over the next year.
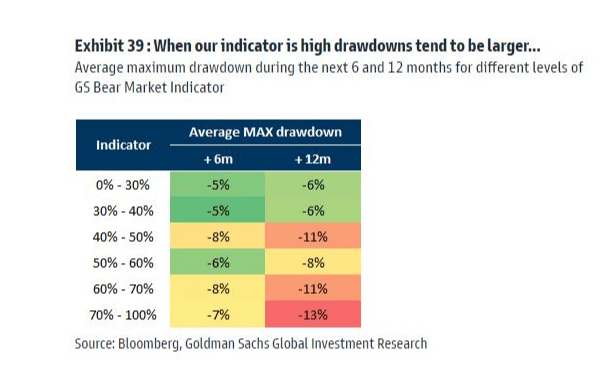
Indicator levels above 70% have historically coincided with bigger moves lower in stocks in the next 12 months. Source: Goldman Sachs.
In Goldman’s most recent analysis, it also found that the indicator predicted lower expected returns.
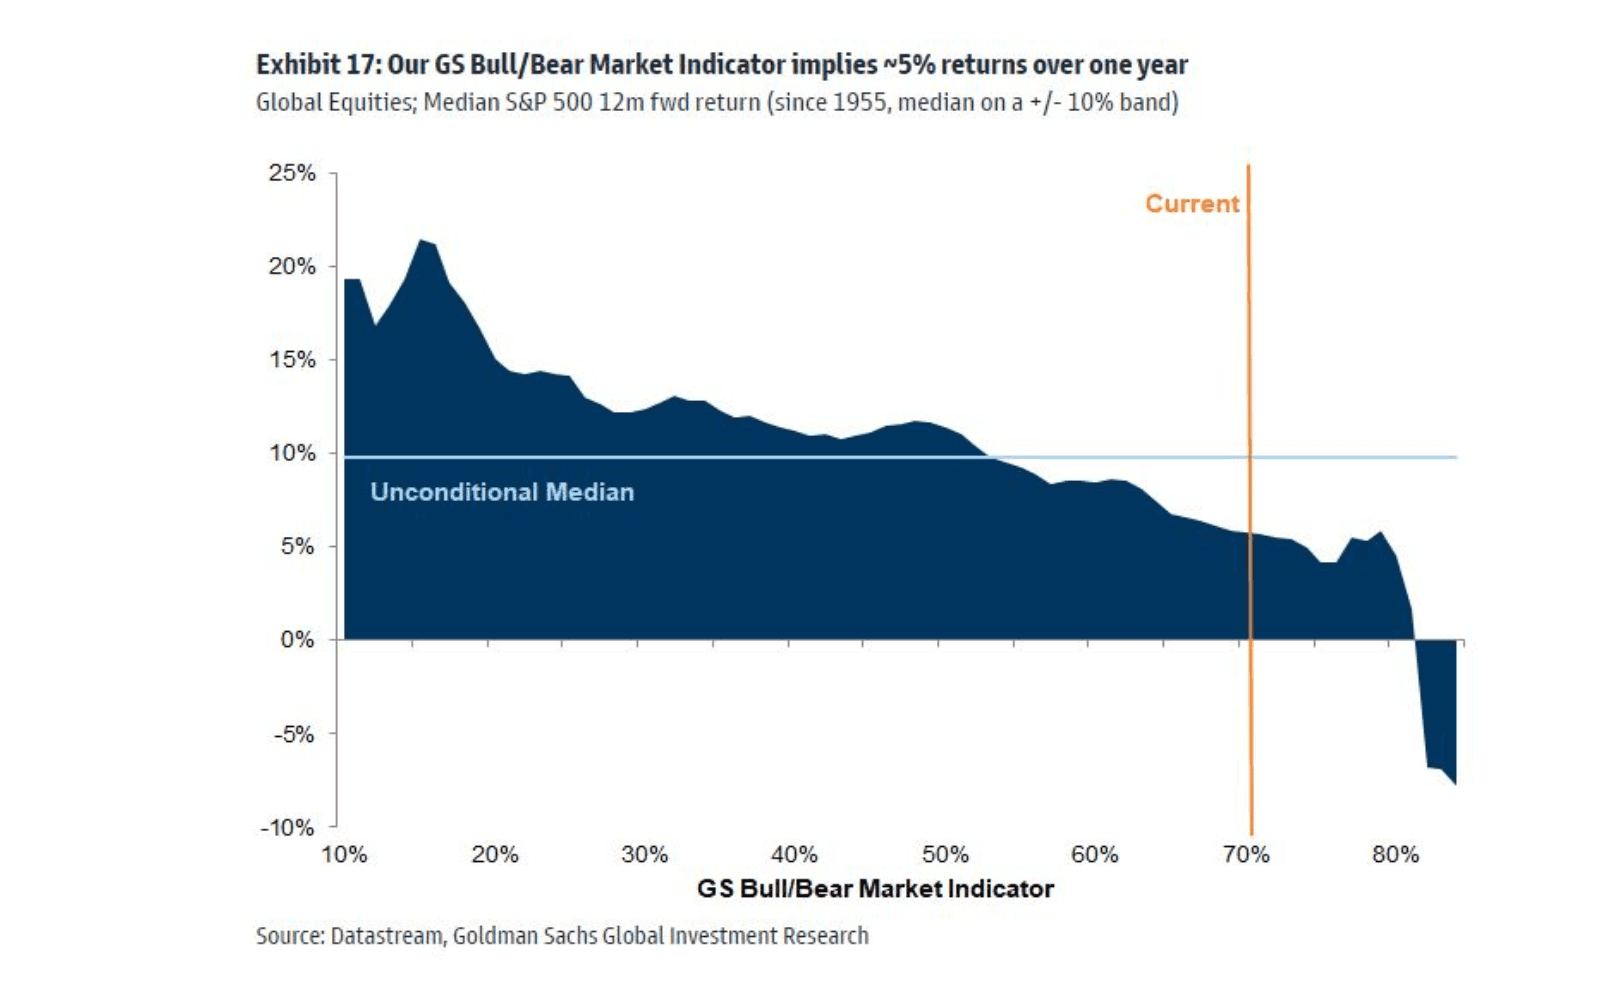
The higher the indicator’s level (horizontal axis), the lower the future returns (vertical). Source: Goldman Sachs.
So, what’s the takeaway here for you?
Goldman Sachs’s bear indicator is hardly a perfect beast, but it is sending a warning signal that a downward move is likely in the not-too-distant future and that returns are likely to be capped. And that might be reason enough to consider trimming your exposure to US stocks and perhaps allocating more of your money to defensive assets like Treasury bonds or holding more in some higher-yielding cash accounts – at least until some more attractive opportunities arise.
Stéphane Renevier is a global markets analyst at finimize.
ii and finimize are both part of abrdn.
finimize is a newsletter, app and community providing investing insights for individual investors.
abrdn is a global investment company that helps customers plan, save and invest for their future.
These articles are provided for information purposes only. Occasionally, an opinion about whether to buy or sell a specific investment may be provided by third parties. The content is not intended to be a personal recommendation to buy or sell any financial instrument or product, or to adopt any investment strategy as it is not provided based on an assessment of your investing knowledge and experience, your financial situation or your investment objectives. The value of your investments, and the income derived from them, may go down as well as up. You may not get back all the money that you invest. The investments referred to in this article may not be suitable for all investors, and if in doubt, an investor should seek advice from a qualified investment adviser.
Full performance can be found on the company or index summary page on the interactive investor website. Simply click on the company's or index name highlighted in the article.