FTSE for Friday: up or down for the volatile index?
14th October 2022 07:18
by Alistair Strang from Trends and Targets
Despite rallying almost 120 points from its post-US inflation data low, the FTSE 100 is not out of trouble. Independent analyst Alistair Strang reveals his latest target levels for the UK index.

Thursday proved a strange day for markets worldwide, but of all the markets we cover, only the FTSE 100 made our jaw drop.
By any standards, Thursday was weird with five of the six indices we cover for clients hitting targets, all targets. Firstly, they started the day by successfully hitting all our Short position targets, then bounced and triggered movements to our Long position targets.
- Read about: Free regular investing | Opening a Stocks & Shares ISA | Cashback Offers
Once again, all targets were successfully achieved. Except for the UK index which pouted, refusing the play the game. In fairness, this sort of thing is quite rare with individual indices, but when it occurred with virtually all markets, we didn't know what to make of things. Perhaps it shall be the case the FTSE was just "slow" and maybe Friday shall surprise everyone.
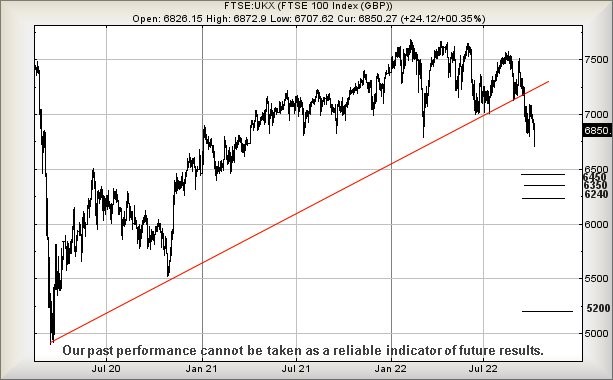
There's very little positive to be said about the UK index and, currently, we must conclude the FTSE 100 is heading down to around 6,450. But it may be about 6,350 points or even 6,240 points. The absurd thing, when we collate this series of numbers, is we could even believe the UK index really intends an a visit to around 5,200 points eventually, because it makes sense numerically.
From a Big Picture perspective, the UK index needs above 7,200 points to give an indication it is climbing out of the gutter. The index is running low on nails to hammer into its coffin, closing Wednesday this week at a new "lower low", achieving a price level not witnessed since April last year.
Past performance is not a guide to future performance
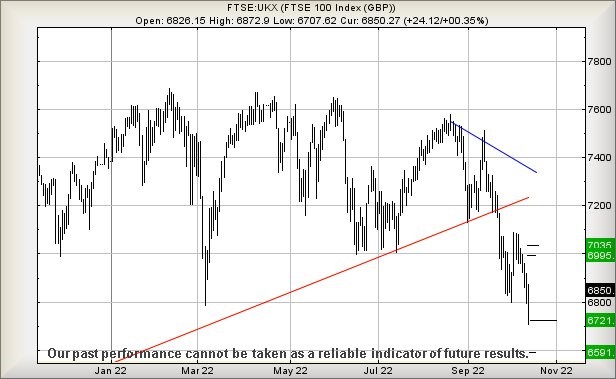
From a near-term perspective, if the FTSE 100 intends follow the rest of the world in making an upward lunge, above just 6,902 points (it closed Thursday at 6,852) should prove capable of triggering party time, as a movement to 6,995 calculates as possible.
If exceeded, our secondary works out at an improbable looking 7,035 points. If triggered, the tightest stop loss level looks like 6,826 points.
Our alternate scenario looks harder to trigger, requiring the index below 6,770 points to push the potential of a drop to 6,721 points. If broken, our secondary calculates down at 6,591 points.
- The 100-year decline of the British pound from five to one dollar
- Chart of the week: spelling out the risk of a FTSE 100 crash
A glance at the chart below reveals something important. Despite our positive scenario above giving a suggestion of an impressive 130-point gain, there's very little about the visual picture which inspires confidence.
Instead, the words "shuffling deckchairs on the Titanic" spring to mind as the FTSE must exceed 7,100 points to give the very first indication some recovery of strength is possible. Even if Friday proves to be a happy day for the FTSE, the index needs to recover quite firmly to remove the odour of dead cats around an immediate bounce.
Past performance is not a guide to future performance
Alistair Strang has led high-profile and "top secret" software projects since the late 1970s and won the original John Logie Baird Award for inventors and innovators. After the financial crash, he wanted to know "how it worked" with a view to mimicking existing trading formulas and predicting what was coming next. His results speak for themselves as he continually refines the methodology.
Alistair Strang is a freelance contributor and not a direct employee of Interactive Investor. All correspondence is with Alistair Strang, who for these purposes is deemed a third-party supplier. Buying, selling and investing in shares is not without risk. Market and company movement will affect your performance and you may get back less than you invest. Neither Alistair Strang or Interactive Investor will be responsible for any losses that may be incurred as a result of following a trading idea.
These articles are provided for information purposes only. Occasionally, an opinion about whether to buy or sell a specific investment may be provided by third parties. The content is not intended to be a personal recommendation to buy or sell any financial instrument or product, or to adopt any investment strategy as it is not provided based on an assessment of your investing knowledge and experience, your financial situation or your investment objectives. The value of your investments, and the income derived from them, may go down as well as up. You may not get back all the money that you invest. The investments referred to in this article may not be suitable for all investors, and if in doubt, an investor should seek advice from a qualified investment adviser.
Full performance can be found on the company or index summary page on the interactive investor website. Simply click on the company's or index name highlighted in the article.