Four American banks: buy, sell, hold?
19th October 2022 08:52
by Rodney Hobson from interactive investor
Analysing the bank sector’s contribution to US results season, our overseas investing expert issues ratings for these big earners on low valuation multiples.

While a succession of British chancellors have struggled to square the circle of sluggish growth and sharply rising inflation, American banks have enjoyed the fruitful landscape of rising interest rates coupled with persistently high levels of employment. Against that background, third-quarter results got off to a disappointing start.
The big bugbear, as interactive investor analyst Keith Bowman explained in his coverage of results from JPMorgan Chase & Co (NYSE:JPM) and Citigroup Inc (NYSE:C), is the continuing lack of lucrative bid deals in the current economic uncertainty, with global deal-making contracting for the third consecutive quarter.
- Discover more: Buy international shares | Interactive investor Offers | Most-traded US stocks
It is worth remembering, though, that the outlook is less bleak than it was three months ago when big US banks generally reported far worse figures. But, in this topsy turvy world, where the banking sector has already gone through a correction after last year’s sharp rise in share prices, the stock market is not always reacting well to the superficially best updates.
This theme was continued by Bank of America Corp (NYSE:BAC), which saw a 46% slump in investment banking fees.
Greater returns on loans made at higher interest rates meant that total revenue was up 7% on the previous third quarter, but increased costs and provisions for possible credit defaults trimmed net income by 8% to $7.1 billion.
Even so, the market had expected worse, and the shares perked up to around $35 after slipping from $49 at the start of this year to a recent low of $30. At the current level the price/earnings (PE) ratio of 10.64 allows for further difficult trading conditions while the yield of 2.5% offers some compensation.
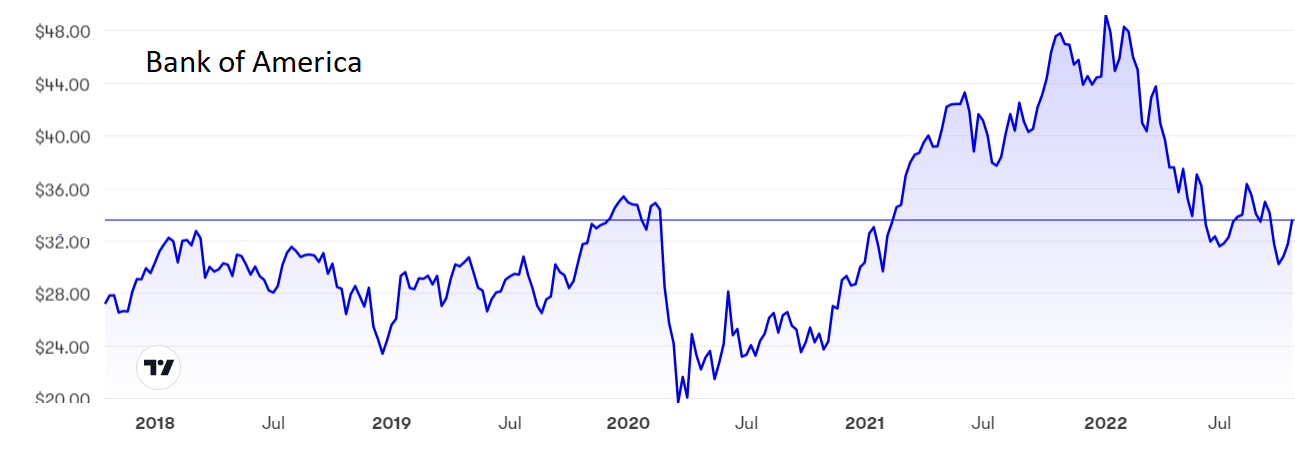
Source: interactive investor Past performance is not a guide to future performance
In contrast, Morgan Stanley (NYSE:MS) fell short of analysts’ expectations, with net revenue down 12% to $12.99 billion and net income 29% lower at $2.63 billion, thanks to a remarkable 55% tumble in investment banking fees and a mediocre performance in investment management.
The yield of 3.73% is high for the US banking sector, offering the only crumbs of comfort.
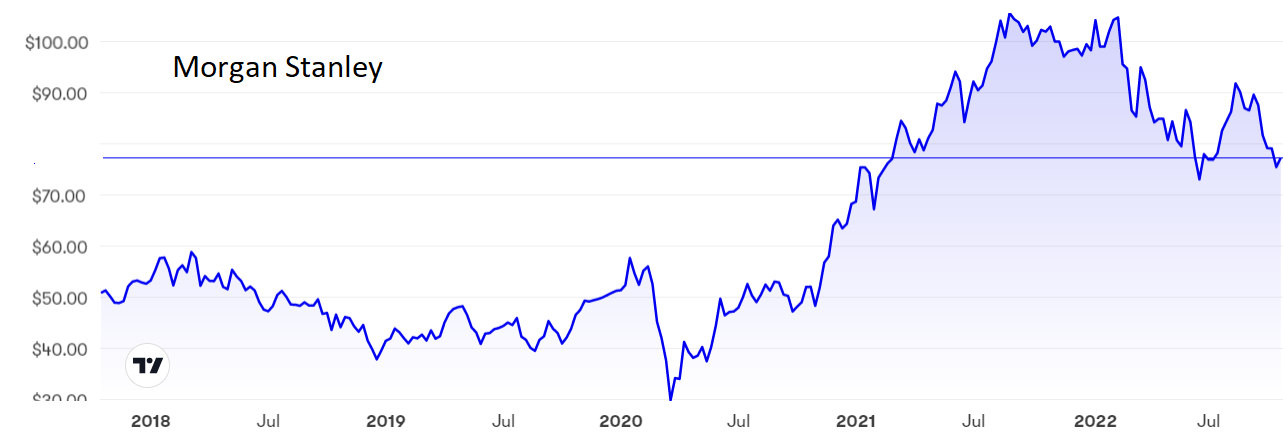
Source: interactive investor Past performance is not a guide to future performance
Wells Fargo & Co (NYSE:WFC) joined the dismal queue by reporting a 31% drop in net income to $3.53 billion. Mercifully, all was not as bad as it seemed at first glance. The bank took a $784 million hit from provisions against loan defaults compared with a somewhat premature $1.4 billion writeback last year.
Without that $2 billion turnaround in charges, plus a further $2 billion charge against litigation and regulatory breaches, underlying profits were actually ahead of last year, and revenue grew as lending expanded.
Average deposits slipped slightly but still easily covered a double digit rise in loans.
- Investors keep buying US equities as results season hots up
- A stock with this kind of consistency is worth paying for
- Time to buy one of Warren Buffett’s favourite stocks now?
Wells Fargo is still struggling to put a range of historical issues behind it, including one scandal involving fake accounts going back six years. It admits that more such setbacks could crop up before it can see daylight. In the meantime, more expenses are being incurred.
Yet the underlying business is, on balance, doing reasonably is not spectacularly quite well. Revenue edged up 3.4% to $19.51 billion, thanks to a strong rise in net interest income that benefitted from the increased spread between lending and borrowing rates. Further such increases look certain as interest rates continue to rise.
Small business banking and commercial banking are two other success areas, while wealth and investment management is struggling to make headway.
The shares twice tried in vain to push above $60 at the start of this year before falling back to around $40 but they did perk up a bit when the quarterly results were, on balance, seen in a favourable light. At least they were much better than the very disappointing ones for the second quarter three months ago.
At $45 the PE ratio is an undemanding 11.42 while the yield is 2.27%.
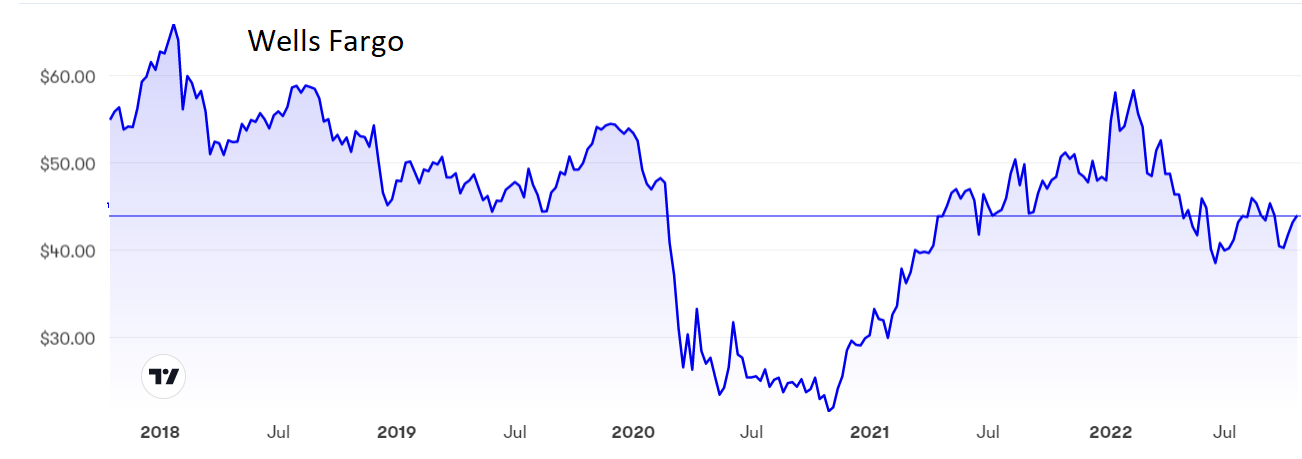
Source: interactive investor Past performance is not a guide to future performance
The Goldman Sachs Group Inc (NYSE:GS) figures were so poor they prompted an internal restructuring that will reduce four divisions to three. Net revenue dropped 12% to $11.98 billion, while net profit tumbled 43% to $3.07 billion. While $515 million in extra provisions for bad debts was part of the reason for the profit fall, it was not the only culprit: investment banking and asset management both suffered.
The shares surprisingly opened nearly 3% higher on the figures although at $314 they are still well below a peak of $420 set 15 months ago. The lowly PE of 6.93 reflects justified worries over Goldman’s performance so far this year although the yield of 2.77% is an attraction.
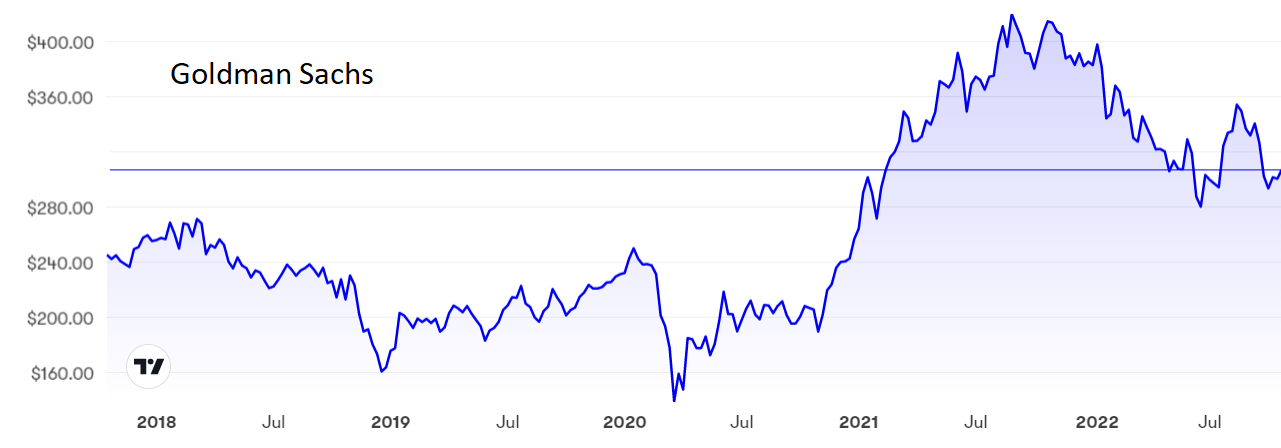
Source: interactive investor Past performance is not a guide to future performance
Hobson’s choice: I rated Wells Fargo a sell in July and the shares are still not for cautious investors. However, the outlook is slightly better now and, if you stayed in, then you should continue to ‘hold’, but with your fingers crossed.
My warning at the start of this year that Bank of America looked overvalued has been vindicated but this could be a good time to ‘buy’ in for recovery.
Morgan Stanley is particularly difficult to call at the moment. I was right to advise selling last October above $100 but I relented in July after a correction took the shares below $80. The shares are still around $79 but deserve no more than a ‘hold’ until there is clearly better news.
I retain my hold rating on Goldman although shareholders should consider ‘taking profits’ if there is a strong rally.
Rodney Hobson is a freelance contributor and not a direct employee of interactive investor.
These articles are provided for information purposes only. Occasionally, an opinion about whether to buy or sell a specific investment may be provided by third parties. The content is not intended to be a personal recommendation to buy or sell any financial instrument or product, or to adopt any investment strategy as it is not provided based on an assessment of your investing knowledge and experience, your financial situation or your investment objectives. The value of your investments, and the income derived from them, may go down as well as up. You may not get back all the money that you invest. The investments referred to in this article may not be suitable for all investors, and if in doubt, an investor should seek advice from a qualified investment adviser.
Full performance can be found on the company or index summary page on the interactive investor website. Simply click on the company's or index name highlighted in the article.
Disclosure
We use a combination of fundamental and technical analysis in forming our view as to the valuation and prospects of an investment. Where relevant we have set out those particular matters we think are important in the above article, but further detail can be found here.
Please note that our article on this investment should not be considered to be a regular publication.
Details of all recommendations issued by ii during the previous 12-month period can be found here.
ii adheres to a strict code of conduct. Contributors may hold shares or have other interests in companies included in these portfolios, which could create a conflict of interests. Contributors intending to write about any financial instruments in which they have an interest are required to disclose such interest to ii and in the article itself. ii will at all times consider whether such interest impairs the objectivity of the recommendation.
In addition, individuals involved in the production of investment articles are subject to a personal account dealing restriction, which prevents them from placing a transaction in the specified instrument(s) for a period before and for five working days after such publication. This is to avoid personal interests conflicting with the interests of the recipients of those investment articles.