Are investors entering a new golden age?
Amid record prices for gold, a Kepler analyst considers the outlook for the precious metal and suggests ways to play the asset.
25th October 2024 14:29

This content is provided by Kepler Trust Intelligence, an investment trust focused website for private and professional investors. Kepler Trust Intelligence is a third-party supplier and not part of interactive investor. It is provided for information only and does not constitute a personal recommendation.
Material produced by Kepler Trust Intelligence should be considered a marketing communication, and is not independent research.
Gold has had a great year, having broken through the $2,600 an ounce level in September. It had been hovering around the $2,000 an ounce level at the start of 2024. It is now at an all-time high.
- Invest with ii: Buy Investment Trusts | Top UK Shares | What is a Managed ISA?
How you react to this news is arguably indicative of your psychological type. Does it make you want to go out and buy some (more) gold, or does it make you want to avoid it, selling whatever you own? We would expect most people to be more of the first persuasion, and inclined to jump on what is going up.
It is a fairly basic human drive to seek security in numbers. If this is right, then value investors are weird psychological screw-ups, and arguably barely even human. Readers will have to judge for themselves whether that rings true.
Joking aside, it is genuinely difficult to put sentiment and emotions away when deciding how to handle assets that are on a tear. Perhaps this is why so few active managers have been overweight NVIDIA Corp (NASDAQ:NVDA)? This has been a fundamentally wrong decision since at least January 2022, when Nvidia was trading at $15 a share. The price is $117 at the time of writing. If investing is about making money, then underweighting Nvidia after it had doubled and after it had quadrupled was wrong, wrong, wrong.
Are investors also wrong to avoid gold after its 41% rise over the past 12 months?
Gold’s track record
One way to approach this problem is to consider what happened in gold’s last bull run. This will allow us to consider the factors that led to the collapse from the previous peak and assess how these factors look now. The chart below shows the gold price over the past 20 years.
The basic story is that gold rallied in the aftermath of the great financial crisis of 2007-08. Notably, it didn’t do so during the crisis, likely because the margin calls suffered by major investors and other demands for liquidity saw portfolios liquidated. However, from late 2008 the metal rallied until September 2011, when it peaked at $1, 910 an ounce. It then fell to $1,062 over the next four years, a decline of 43%.
It didn’t do much until 2019, when began a steady rise that was propelled higher by the pandemic striking. In July 2020, gold finally broke through its old high, and briefly traded past $2,000. It was then pretty much rangebound, testing the $2,000 levels a couple of times before breaking through decisively in December 2023. Before we consider in detail what has driven these moves, we think it is notable that gold has tended to be pretty rangebound for long periods of time, with large moves happening in relatively short time periods.
Big Round Numbers and previous highs also seem to be important. Technical analysis may not always work, but perhaps it is more valuable when dealing with an asset that trades per fixed unit, which means Big Round Numbers have more psychological power, and everyone is trading this number rather than looking at cash flows, dividends, total returns, P/Es or something else.
SPOT GOLD PRICE
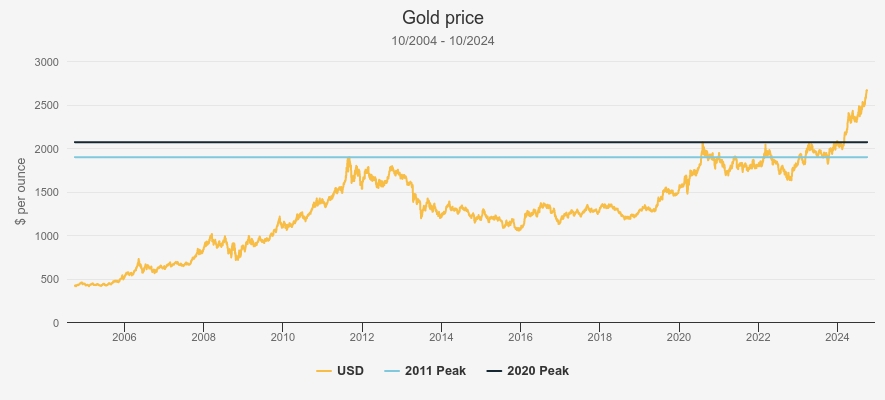
Source: Morningstar, Kepler calculations. Past performance is not a reliable indicator of future results
The last peak
Let’s consider what led gold to collapse by 43% from its 2011 peak. One factor was simply the subsidence of concerns about the global financial system. After 2008, many were convinced that there were more consequences of the global financial crisis to play out, and there were fears that more institutions could become insolvent. It was also worried that the risk had shifted on to sovereign balance sheets, and countries were at risk of insolvency. The eurozone became a focus of these concerns, leading to the crisis of 2011. During this environment, interest rates were at zero, and even 10-year government bonds were yielding 2% or less, so diversifying cash into gold made sense overall.
When the eurozone crisis was seen as being resolved, this relieved pressure on the global financial system, while the US was delivering healthy GDP growth. Congress raised the US debt ceiling, which relieved one lingering worry. As the US recovered, the outlook for monetary policy changed. There was scope for interest rates to rise, and yields certainly did. This increased the opportunity cost for holding gold. There was also no significant inflation: another post-financial crisis fear dying out. It was widely predicted at the time of the crisis that QE would lead to inflation, but by 2011-12 it was clear this was wrong. The dollar rose in value and the US investor, or US-centric equity investor, was more concerned about not missing out on equities than being protected against a market collapse.
All this is a very Occidentalist picture, and the chart below of ETF flows shows how it was Western demand that collapsed, with North American and European investors selling huge amounts of gold in 2013. The huge spike in demand from North America in 2020 is also interesting, and worth discussing later.
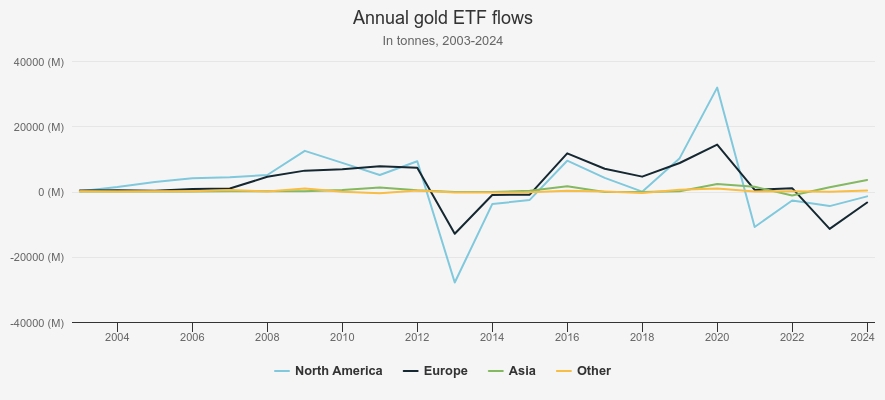
Source: World Gold Council
Asian demand and demand from ‘Other’, which would include other non-developed countries, was down by an equivalent proportion (this chart is in absolute terms), but the ETFs are really a Western story. This is underlined by the chart below, from the World Gold Council. Asian holdings have been rising, but they are still insignificant as a driver of ETF demand. We would also highlight that North American and European holdings of ETFs remain well down from their 2020 peak and have only just started to pick up.
GOLD ETF HOLDINGS
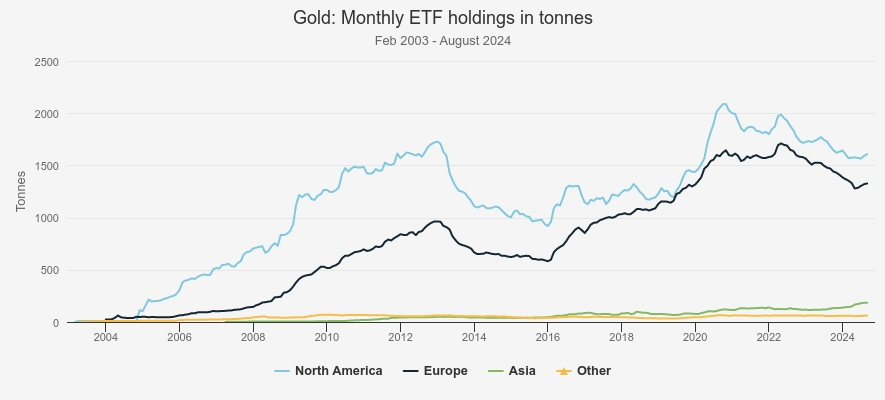
Source: World Gold Council
Demand from emerging markets depends on some different factors. In India, gold is a popular store of wealth and a savings vehicle, while it is widely given as a wedding gift to brides. As such, demand for gold should have some positive correlation to India’s economic health. This is a little different from the West, where gold demand tends to be driven by economic distress. Thinking back to 2011, a depreciation of the rupee led to outflows from the currency and a 33% fall in jewellery and investment demand from India in the second half.
This is in contrast to Western demand, which fell thanks to economic risks subsiding. Chinese demand during the period was also influenced to some extent by a positive correlation with Chinese wealth. Considering the outlook for gold at this moment, it is important to think about emerging market and developed market demand differently – and the emerging markets have changed a lot over 13 years. India’s GDP has almost doubled since then (it’s up circa 95%). China’s economy has grown even faster, and is now 2.4 times as large as it was then. The data is from the World Bank and is in nominal, US-dollar terms and reflects the size of the total economy, not per capita.
The latest rally
Turning back to the recent rally, it is evident that gold’s recent strength stems at least in part from the Russian invasion of Ukraine in 2022, and certainly we can describe the post-invasion period as a distinct chapter. In the first weeks of the invasion, gold spiked above $2,000 an ounce. It then stayed within a higher range than pre-invasion, before spiking again in 2024.
Gold does tend to spike when geopolitical and military risks abound, and this has likely been a factor behind the strength in recent weeks, given events in the Middle East. But there are other factors that have probably been driving it higher.
GOLD PRICE PER OUNCE
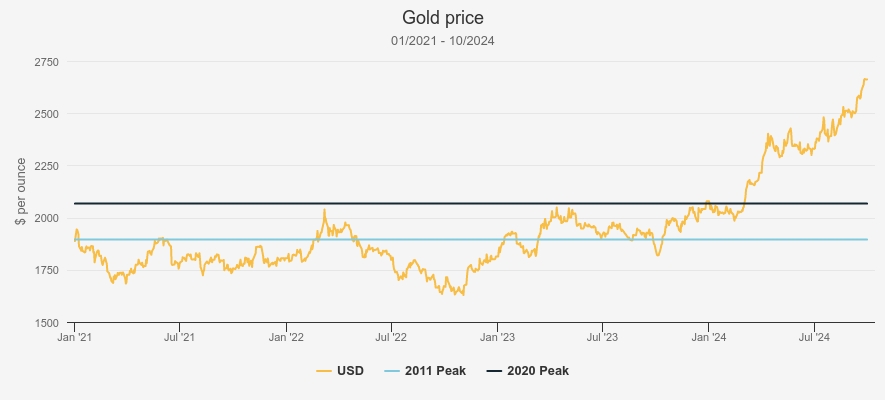
Source: World Gold Council. Past performance is not a reliable indicator of future results
Perhaps more interesting is what hasn’t been driving it higher. From our discussion of the last peak it is evident that risk aversion in the US and developed world was key behind gold’s strength. Additionally, a low rates environment increased the attractions of it as a safe haven versus cash or bonds – given the latter weren’t delivering real returns of any significance. Rising bond yields theoretically should spell trouble for gold, all other things being equal, at least for the Western investor, or the investor in US government bonds. Yet gold has been strong amidst the highest yields on government bonds since 2008. US real rates have risen since 2022 as inflation has fallen, and yet the gold price has risen.
It is true that in 2024 the market has been preparing for US rates to fall, and this could have kept the price of gold high if investors were anticipating this move. If that were the case, we would expect to see inflows into ETFs, the main way Western investors take exposure to gold. We would also expect to see some weakness when the rate cuts actually come, as investors sell the fact, having bought the rumour. But neither are the case. In the fund flow data above, we highlighted that there has been a very slight uptick in ETF demand from North America and Europe in recent weeks (which could be attributed to geopolitical risks rather than rate cuts), but ETFs have seen outflows overall in 2024. And Western holdings remain well below where they were in 2020. Meanwhile, when the Fed finally pulled the trigger in September, gold strengthened further.
US TEN-YEAR YIELD
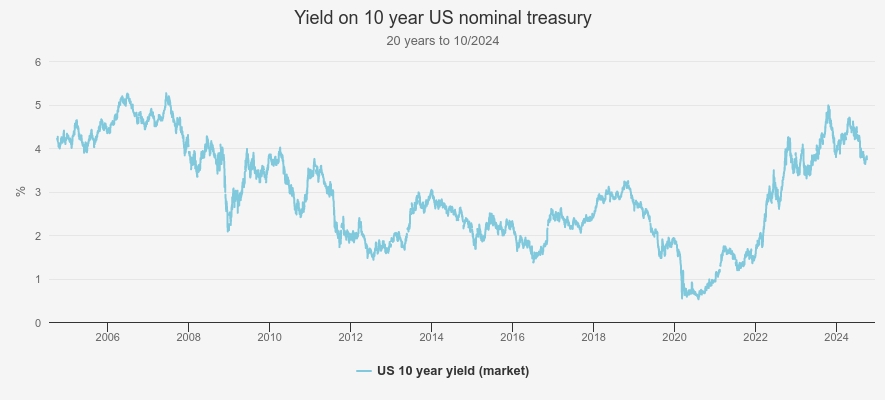
Source: St Louis FRED. Past performance is not a reliable indicator of future results
From this we draw two conclusions. First, that the impact of rate cuts haven’t yet been felt in the gold price – this is bullish. And secondly, something else has been driving gold higher.
Bye, bye, American pie
The Russian invasion of Ukraine was met by (eventually) severe sanctions on Russian assets held abroad. Amongst many measures was the decision to freeze something like $350 billion in sovereign reserves. According to Reuters, these included around $207 billion in euro assets, $67 billion in US dollar assets and $37 billion in British pound assets. Russian central bank reserves were held openly in accounts abroad, it being generally expected that central banks would continue to deal with one another. For context, the US didn’t freeze the central bank reserves of Nazi Germany until June 1941, despite the fact the US had been increasingly involved in supporting the British war effort.
This act was likely seen as a warning shot by countries that either aren’t friendly to the US and its allies, or could conceivably see themselves not being friendly in the future. Most importantly, China is likely to have taken note, given the tensions over Taiwan. Chinese holdings of US Treasury Bonds have fallen significantly since 2017, when Donald Trump gained the White House and ramped up the war of tariffs and trade with China. They fell from $1.2 trillion in August 2017 to $1 trillion in February 2022, when Russia invaded Ukraine. Since then, they have seen a precipitous decline, recorded as $777 billion as of July 2024 (according to US government statistics).
It seems evident that China is worried about the wisdom of keeping its assets in US bonds, and no doubt other countries are too. Holding US government bonds also serves to perpetuate the dollar-based international system, which gives the US many economic privileges. China has openly been working to create a rival system based around the yuan, doing deals with a number of countries to buy oil in its own currency rather than dollars, including Saudi Arabia, nominally a US ally. The Western confiscation of Russian assets has given this trend extra impetus.
Central banks like diversity in their reserves, and gold has always played a role. However, in 2022 there was a record amount of gold buying by central banks, which rose from 400 tonnes in 2021 to over 1,000 tonnes. The next year, 2023, also saw over 1,000 tonnes bought, although a little less than 2022. The first half of 2024 was a record first half, and up 5% on the previous record set for the period – exactly one year earlier. Banks cite the usual reasons when asked: performance in a crisis, diversification, store of value, etc., but we think you’d be naïve to think politics wasn’t playing a role.
We also have to consider purchases by unofficial means. China is widely suspected of being a major buyer on the London market. Goldman Sachs estimates that emerging market central banks were responsible for around 730 tonnes of gold purchases in London in 2024, to the end of July. This is equivalent to 15% of global annual production, and is on top of any official purchases. They estimate China is the main player, and they note that buying gold in dollars in London helps reduce their dollar reserves too (which buying on their home Shanghai Gold Exchange would not).
Not like last time
Turning back to our list of factors that impacted gold’s last fall from grace, we can consider how they shape up now. As we have touched on already, the rates picture suggests gold’s rise will continue. US rates are likely to fall in the coming months, as are UK and European. It is possible we have seen investors start to react to this prospect with ETF inflows picking up slightly, but we are well below past levels of gold holdings in these vehicles, and we think this move has barely begun.
If the US economic picture darkens, it would be another potentially positive factor . The worse any economic decline is, the more demand for gold from worried US investors should rise. Worse economic performance makes the argument for more rate cuts, which would also be positive for gold. That said, recent data has been ambiguous at best, so this factor may end up a negative for gold from here.
As for the emerging markets, it is here that things are the most different from the past cycle. China and India have much larger economies than they did in 2011 and much greater political power. India’s economic strength should be a positive for gold demand as the wealth of its middle class grows, given Indians tend to favour gold as a store of wealth and as gifts. We would also suggest that Chinese wealth is likely to trickle into the gold market too. Chinese investors are smarting after a real estate bust that damaged a common investment strategy of speculating on property. With the Chinese limited in their ability to invest overseas, thanks to capital controls, gold offers a useful source of diversification and can be bought on the domestic market. We think emerging market factors are likely to be much more important to the gold price than they have in the past, and Western demand correspondingly less important.
Most important to our mind is the geopolitical aspect. There seems little hope of tensions between the West and China easing considerably in the coming years (particularly if Trump is re-elected). And it seems unlikely, to say the least, that relations with Russia will improve for many years. Meanwhile, China is likely to continue to use its economic and political power to promote an alternative to the dollar-based system and to reduce its investment in US-dollar assets. India has a keen sense of its own interest, and it looks likely it will be happy to see Western power weaken and participate in any alternative systems, while remaining on good terms with the US. (Perhaps one of the interesting things to watch in geopolitics will be how the US and Europe deal with India, and whether they will attempt to strong-arm it away from Russia and China.) All this is likely to favour gold too.
Conclusion
It is hard not to conclude that the outlook for gold is bright. But a note of caution is warranted. The central bank buying process we have noted is a long-term process, as is the shift of emerging markets away from a dollar-based system. Central banks are not going to be totally price-insensitive, and we think it is unwise to assume gold can’t see drawdowns or hit new trading ranges as this process goes on. On a similar note, we should be wary of the impact of any decline in geopolitical tensions. The initial spike in the gold price after the invasion of Ukraine was quickly walked back, and Western demand, speculation and long-term buyers waiting for better entry points could well see any ceasefire in the Middle East or Ukraine lead to a sharp decline in the gold price. In our view, though, there is a strong case to be made for holding gold in a portfolio, and the outlook offers the potential for prices to remain high, and possibly move higher over the coming months and years.
However, we certainly aren’t the only people to think there are risks to gold’s current highs. Duncan McInnes and Jasmine Yeo, managers of Ruffer Investment Company Ord (LSE:RICA)have sold their physical gold holdings this year. They have, though, invested the cash in gold miners instead. They argue that the miners are cheap in relation to the gold price, and offer exposure to some of the same trends as the metal but with less downside, given their valuations. This move has paid off in recent months, as gold miners have finally started to do well.
When we spoke to Rob Crayfourd and Keith Watson, managers of Golden Prospect Precious Metal Ord (LSE:GPM)recently, they explained that the miners have struggled, thanks to the inflation of their cost base. It is primarily labour costs that have been the issue, while energy prices have also weighed on profitability. With inflation coming down and gold prices being high, the sector looks set up well. In fact, over the past six months or so they have rallied hard; GPM is up circa 34% year-to-date in NAV terms, yet still trades on a 17% discount, offering another level of value. Rob and Keith note that the whole gold mining sector is tiny and illiquid, so only a small increase in investors’ allocations to the sector could make the prices move significantly.
While GPM is mostly invested in gold miners, with a 79% allocation, BlackRock World Mining Trust Ord (LSE:BRWM) has just 23% invested in this sector. BRWM also offers exposure to the industrial metals that are more economically sensitive. The trust’s returns have been much more modest year-to-date, at just under 6.5%, with weakness in China weighing on many key commodities like copper and iron ore. These metals have soared in recent weeks though, as the Chinese authorities have unveiled stimulus measures. BRWM is much less of a pure play on gold, but offers a broader package of commodity exposures. The discount is narrower at c. 7% and the shares haven’t quite kept up with the NAV in the recent rally.
In our view, a gold ETF is an attractive long-term asset to hold, given the trends we highlighted. The potential gains in miners may be higher though, thanks to the low valuations relative to the commodity itself. A fund seems a more sensible way to play this sector for many investors rather than investing directly, given the complexity of the industry, the fact it is mostly based abroad and the potential volatility in individual companies’ share prices.
Kepler Partners is a third-party supplier and not part of interactive investor. Neither Kepler Partners or interactive investor will be responsible for any losses that may be incurred as a result of a trading idea.
These articles are provided for information purposes only. Occasionally, an opinion about whether to buy or sell a specific investment may be provided by third parties. The content is not intended to be a personal recommendation to buy or sell any financial instrument or product, or to adopt any investment strategy as it is not provided based on an assessment of your investing knowledge and experience, your financial situation or your investment objectives. The value of your investments, and the income derived from them, may go down as well as up. You may not get back all the money that you invest. The investments referred to in this article may not be suitable for all investors, and if in doubt, an investor should seek advice from a qualified investment adviser.
Full performance can be found on the company or index summary page on the interactive investor website. Simply click on the company's or index name highlighted in the article.
Important Information
Kepler Partners is not authorised to make recommendations to Retail Clients. This report is based on factual information only, and is solely for information purposes only and any views contained in it must not be construed as investment or tax advice or a recommendation to buy, sell or take any action in relation to any investment.
This report has been issued by Kepler Partners LLP solely for information purposes only and the views contained in it must not be construed as investment or tax advice or a recommendation to buy, sell or take any action in relation to any investment. If you are unclear about any of the information on this website or its suitability for you, please contact your financial or tax adviser, or an independent financial or tax adviser before making any investment or financial decisions.
The information provided on this website is not intended for distribution to, or use by, any person or entity in any jurisdiction or country where such distribution or use would be contrary to law or regulation or which would subject Kepler Partners LLP to any registration requirement within such jurisdiction or country. Persons who access this information are required to inform themselves and to comply with any such restrictions. In particular, this website is exclusively for non-US Persons. The information in this website is not for distribution to and does not constitute an offer to sell or the solicitation of any offer to buy any securities in the United States of America to or for the benefit of US Persons.
This is a marketing document, should be considered non-independent research and is subject to the rules in COBS 12.3 relating to such research. It has not been prepared in accordance with legal requirements designed to promote the independence of investment research.
No representation or warranty, express or implied, is given by any person as to the accuracy or completeness of the information and no responsibility or liability is accepted for the accuracy or sufficiency of any of the information, for any errors, omissions or misstatements, negligent or otherwise. Any views and opinions, whilst given in good faith, are subject to change without notice.
This is not an official confirmation of terms and is not to be taken as advice to take any action in relation to any investment mentioned herein. Any prices or quotations contained herein are indicative only.
Kepler Partners LLP (including its partners, employees and representatives) or a connected person may have positions in or options on the securities detailed in this report, and may buy, sell or offer to purchase or sell such securities from time to time, but will at all times be subject to restrictions imposed by the firm's internal rules. A copy of the firm's conflict of interest policy is available on request.
Past performance is not necessarily a guide to the future. The value of investments can fall as well as rise and you may get back less than you invested when you decide to sell your investments. It is strongly recommended that Independent financial advice should be taken before entering into any financial transaction.
PLEASE SEE ALSO OUR TERMS AND CONDITIONS
Kepler Partners LLP is a limited liability partnership registered in England and Wales at 9/10 Savile Row, London W1S 3PF with registered number OC334771.
Kepler Partners LLP is authorised and regulated by the Financial Conduct Authority.