What next for European equities?
10th September 2021 16:01
After a strong period for European equity markets, analysts at Kepler Trust Intelligence ask whether this trend can continue.

This content is provided by Kepler Trust Intelligence, an investment trust focused website for private and professional investors. Kepler Trust Intelligence is a third-party supplier and not part of interactive investor. It is provided for information only and does not constitute a personal recommendation.
Material produced by Kepler Trust Intelligence should be considered a marketing communication, and is not independent research.
Despite Europe’s popularity among holidaymakers, it appears that investors prefer sunnier shores. According to The Investment Association, UK investors were net sellers of European equities in 2018, 2019 and 2020. Historically low returns from European equity markets (compared to other regions) and low GDP growth seem to have soured investors’ moods.
In this article, we will examine the AIC Europe and AIC European Smaller Companies sectors over the last 12 months, to see whether this pessimism is justified today. We’ve chosen to review the last 12 months as they neatly capture the start of the global value rally, kicked off by the successful development of the COVID-19 vaccine. This period also saw a revision of the growth momentum which carried global equity markets, with cyclical and value stocks since seeing a recovery.
As we demonstrate in this article, it was not as clear cut for Europe, as its increased economic activity was shared more equally across companies and trusts.
Market review
Europe has long been assumed to lag its largest economic peer, the US. There is plenty of data to support this notion, given the US has averaged an annualised GDP growth rate of 1.8% over the past ten years, double that of the 0.9% of the European Union. Equity markets tell as grim a story, with the MSCI USA Index returning an annualised return of 17.8% over the last ten years, compared to the 10.3% of the MSCI Europe ex UK.
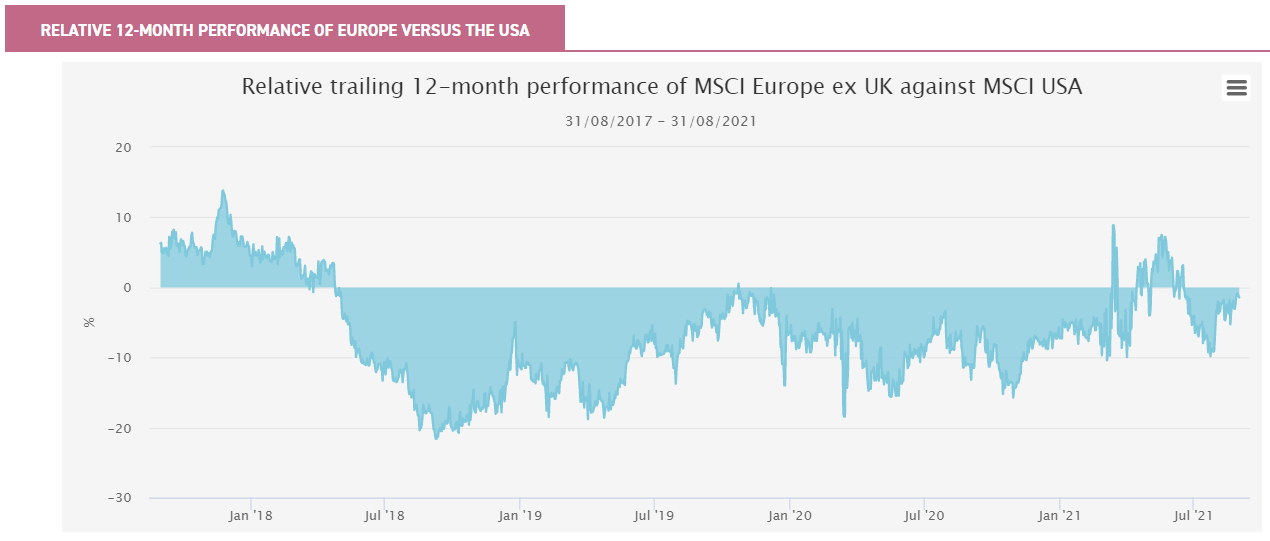
Yet in the short term there have been some positive returns from Europe. In the below graph, we can see the rolling 12-month returns of the European equity index versus the US index. While these returns have tended to be significantly negative, indicating underperformance, in recent months returns have been closer, and for a period of time this spring European equities were ahead for the first time since 2018. This leads to the obvious question – was this a flash in the pan or can it occur again?
Despite the recent improvements in relative performance, Europe continues to trade at a c. 20% discount to the US market based on its aggregate P/E ratio. This has also been the case over the last five years, and may present an attractive valuation opportunity for our value-minded readers.
Source: Morningstar
Past performance is not a reliable indicator of future returns
Europe’s recent return to form can be attributed in part to its relatively effective response to COVID-19, whereby the region was able to implement both widespread lockdowns and a strong vaccine programme, coupled with an effective stimulus programme to reset the economy. Following a period of strong US outperformance, many investors saw opportunities in unloved European equities that were able to capitalise on the strong rebound in economic activity, and which were even more attractive when compared to the stretched valuations that many US stocks traded at by the end of 2020.
As can be seen in the above graph, this led to Europe’s outperformance in the second quarter of 2021, yet it has since again fallen behind the US. We think this is due in part to Biden’s own stimulus programme supporting the US market, but also due to the strong earnings US equities have posted, particularly amongst mega-cap technology stocks, a sector where Europe lags the US by a wide margin.
The roll-out of stimulus across much of the eurozone also played a key role in supporting the region during the pandemic. While at a state level it typically took the form of corporate or social aid measures, the most important measure would come at the supranational level. The successful passing of the Next Generation EU recovery fund was a watershed moment for Europe, and helped buoy European equity markets given that it was ratified in late May 2021 (though the cash is only now being distributed). The €800 billion post-pandemic stimulus package is designed to help kick-start European growth, and is being funded by the first ever jointly guaranteed European debt issuance – arguably a landmark moment for European political and economic unity.
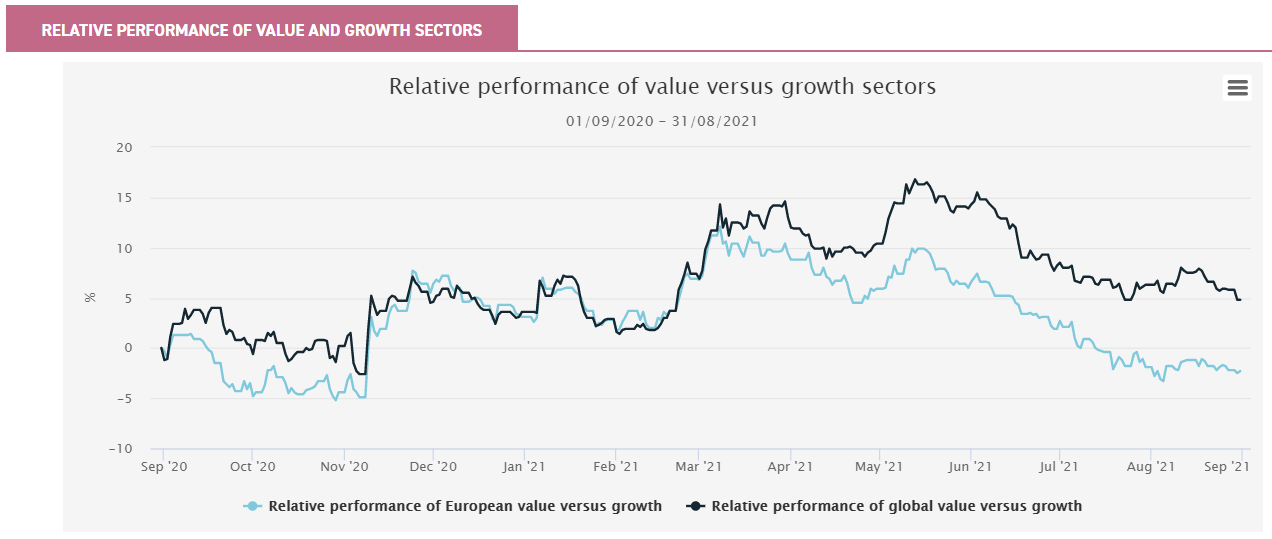
Europe, like almost every other global economy, experienced the ‘reflation’ trade, whereby value and cyclical stocks began to be positively re-rated in Q4 2020, based on expectations of increased economic activity due to the inevitable vaccine roll-out (with Pfizer Inc (NYSE:PFE) being the first to announce successful phase III results in September 2020). Yet the dominance of value did not last long, with European growth stocks having now outperformed value over the last 12 months.
Source: Morningstar
Past performance is not a reliable indicator of future returns
We believe the reversal in the performance of European value stocks is due to European investors increasingly prioritising the winners of an economic rally, rather than simply holding onto re-rated value stocks. Despite the impact of the ‘reflation trade’, it would be European growth sectors like technology which continued to outperform in mid 2021, with many companies posting strong earnings. Also, the global chip shortage is a major windfall for European semiconductor manufacturers.
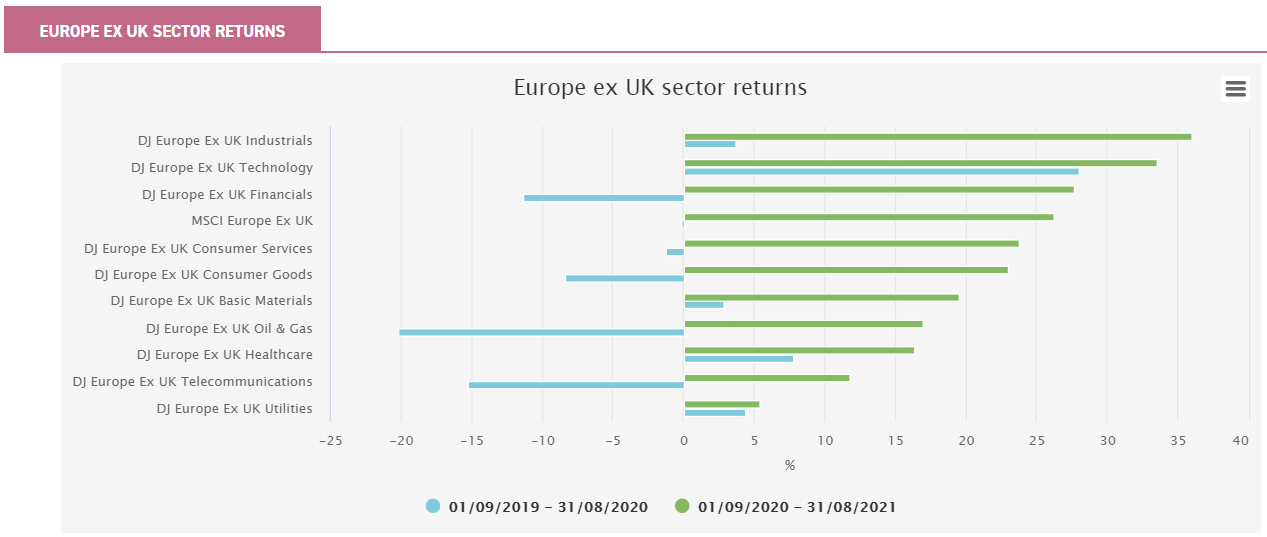
The chart below shows the 12-month returns of European sectors, as well as those of the broader index, for the two most recent 12-month periods. This allows us to identify which sectors outperformed the broader market since the ‘reflation trade’, compared to how they performed over the prior 12 months.
We can see that on a sector level, the major winners of the past 12 months were technology, industrials and financials, the only three sectors to beat the index. The latter two appear to be the greatest beneficiaries of the ‘reflation trade’ given their prior 12-month performance, with industrials and financials containing some of the most economically sensitive industries within Europe (e.g. banks).
We would argue that their strong rebound was not the result of their ‘cheapness’, but rather that these sectors were best positioned to capitalise on the resumption of economic activity. In fact, industrials is defined as a growth sector by Morningstar despite including Europe’s cheaper industrial giants like Siemens AG (XETRA:SIE), thanks to the presence of expensive high-end manufacturing industries. This means European financial stocks were the only true value sector which was able to outperform the broader market over the last 12 months, despite the supportive tailwinds. The relative strength of European growth industries does much to explain the performance hierarchy of European equity trusts, as we highlight in the next section.
Source: Morningstar
Past performance is not a reliable indicator of future returns
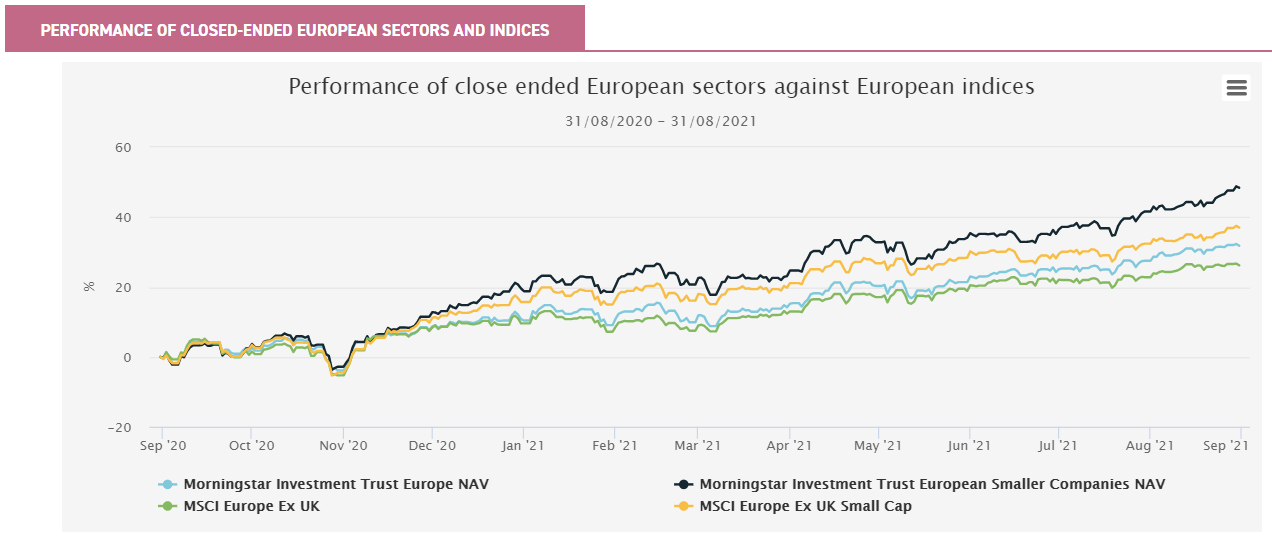
The biggest winner over the last 12 months, however, was European small caps, with the MSCI Europe ex UK Small Cap Index returning 37% and beating the large-cap financial, industrial and technology sectors amongst all the rest. Small-cap companies in general were seen as better able to capitalise on the reopening trends than their large-cap peers, regardless of their style. This is due to the fact that smaller companies are generally perceived to be more sensitive to domestic economic activity, with the vaccine roll-out being the catalyst in this case. As the team behind JPMorgan European Discovery Trust (LSE:JEDT) point out in our recent update, European small caps have long been a far more dynamic and attractive area than large caps, with the sector’s outperformance having stretched back for more than a decade.
The last 12 months have also been a good period for active managers, as the period marked the end of what was a heavily growth-driven market and brought about both changing tailwinds and increased volatility, a situation that offers professional managers more opportunities to add alpha.
This is apparent in the performance of the AIC Europe and AIC European Smaller Companies sectors, given both were able to beat their respective indices over the period, as well as both the US and broader global equity markets. Both sectors have been able to generate greater outperformance over the last 12 months than they have over the prior five years. The average excess return for the large-cap sector versus its benchmark over the last 12 months was 5.5%, versus a five-year average of just 2.2%. For the small-cap sector this was 11.2% versus 2.6%. Gearing has of course helped boost excess returns, as has stock-picking.
Source: Morningstar
Past performance is not a reliable indicator of future returns
Trust review
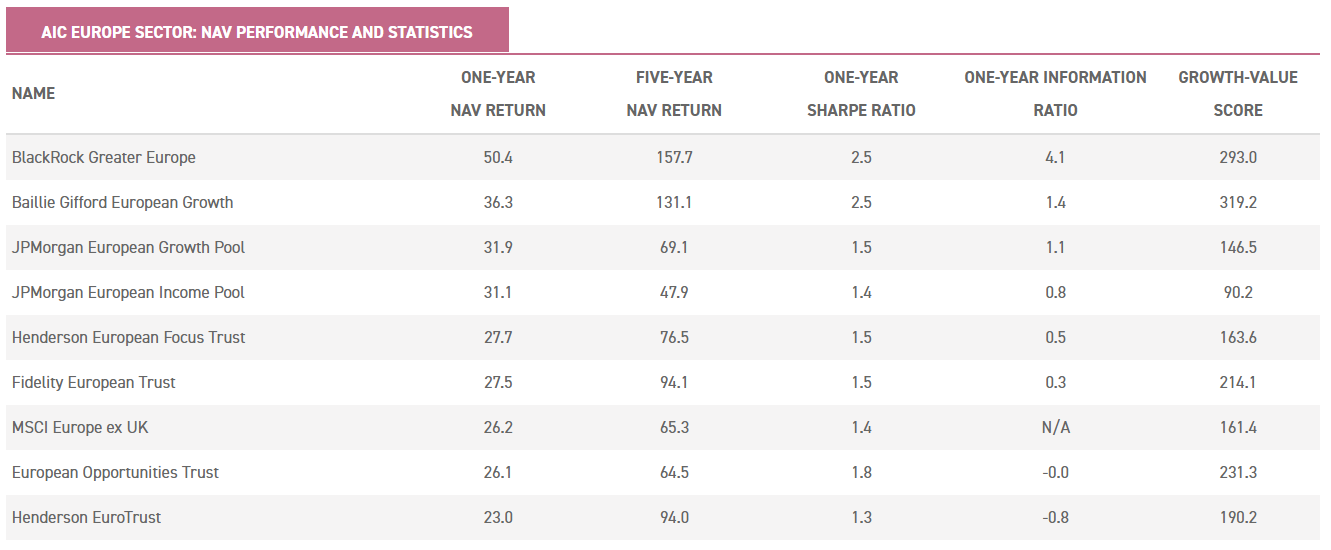
The AIC Europe trusts have had a strong showing over the last 12 months, with the sector returning 31.8% compared to the 26.2% of the MSCI Europe ex UK. What is arguably more impressive is that this outperformance is a general trend across the sector, with six of the eight trusts having beaten the index. The 12-month and five-year NAV returns of the trusts are presented below, along with the Sharpe ratios and information ratios which demonstrate a trust’s risk-adjusted NAV return and the value-add by the managers. We also include Morningstar style data, a convenient metric to identify how tilted a trust is towards growth or value styles (>200 represents a clear growth bias, between 200 and 100 is considered core, and <100 is value).
Source: Morningstar
Past performance is not a reliable indicator of future returns
BlackRock Greater Europe (LSE:BRGE) takes the crown as the best-performing trust, both as the top performer over the last 12 months and over the longer term. This performance has not been the result of active bets around the recovery, but of bottom-up stock selection, and the trust’s turnover has remained low despite turbulent markets.
The primary driver behind BRGE’s outperformance has been its overweight to the technology and industrial sectors. ASML Holding NV (EURONEXT:ASML), the manufacturer of ultra-sophisticated semiconductor fabrication devices, has long been the largest holding for BRGE and continues to be one of Europe’s best-performing large-cap stocks, thanks in part to the global semiconductor shortage. Investors will often find ASML as a top-ten holding in many of the above trusts, though none have as large an overweight to the company as BRGE does.
Dissecting the relative 12-month performance of the broader sector is more complicated than identifying the top performer, however. Other than BRGE and Baillie Gifford European Growth Trust (LSE:BGEU) (which also has a historical overweight to industrials and low turnover approach to growth investing), there is a disconnect between many trusts’ 12-month performance rankings and their five-year rankings.
In the case of JPMorgan European Income Pool (LSE:JETI), the last 12 months have demonstrated the ‘rebound effect’ which many value strategies have experienced as a result of the reflation trade, with JETI being the highest yielding trust in the peer group and one of the few dedicated income strategies.
High-dividend stocks were amongst the worst hit in the crisis, with the fall in global dividend payouts a well-documented occurrence, but many of these stocks sit in industries which stood to gain the most from the rebound, either through large increases in their depressed earnings or through investors gaining confidence that said value stocks would survive into the future.
We believe Henderson EuroTrust (HNE) is has done a particularly good job of navigating markets during the early stages of the pandemic. By utilising its proprietary valuation model, its manager had successfully timed the initial value rotation, purchasing cyclical stocks such as oil majors and financials just as the first vaccine announcements were made. While its current positioning has worked against it, with a reduced allocation to technology and industrials not helping returns in the short term, we believe it offers an excellent track record and we think there may be value in the discount at its current level (see below).
It may also be the case that professional investors underestimated the demand for European growth stocks. Even Fidelity European Trust (LSE:FEV) was unable to fully capitalise on the rapidly moving markets, even though it takes a growth-focussed approach to European equities (albeit a more cautious one than that of BRGE or BGEU). While FEV does retain a large overweight to tech, its outperformance was offset by its overweight to healthcare. With the benefit of hindsight we can now say that despite the recent resurgence in value and cyclical stocks, the best way to have approached European large caps over the last 12 months would have been the same way as the 12 months before that: to overweight growth.
The small-cap sector is a slightly different story, with every single trust having been able to outperform the benchmark over the last 12 months. Furthermore, even over five years the AIC European Smaller Companies sector’s average NAV total return beat that of its large-cap peers.

Source: Morningstar
Past performance is not a reliable indicator of future returns
Stock selection might typically be expected to be more important to returns than style for small-cap peer groups, given the larger universe of mid- and small-cap stocks (the MSCI Europe ex UK has 346 constituents compared to the 759 of its small-cap equivalent), as well as the associated likelihood of there being less overlap between portfolios. However, with the exception of TR European Growth (LSE:TRG), the other three small-cap strategies can be described as some form of ‘quality growth’ investing, with all three overweighting technology and industrial sectors. This common classification goes some way to explaining both the outperformance and tight spread of returns of the three trusts’ 12-month performance.
TRG, on the other hand, is a more valuation-sensitive strategy, leading to its more value-biased portfolio. On average, it also has a lower market cap than its peers, at $1.5bn compared to $37.7 billion. This led to it having a greater sensitivity to economic activity, and thus a stronger rebound in Q4 2020 and Q1 2021.
Unlike the other trusts in the sector, which have continued to hit new highs, TRG peaked in mid June. That month arguably saw the end of value momentum, and TRG has yet to return to that level. The quality growth strategies have rallied since then, supported by the more expensive industrial and technology stocks.
Discounts
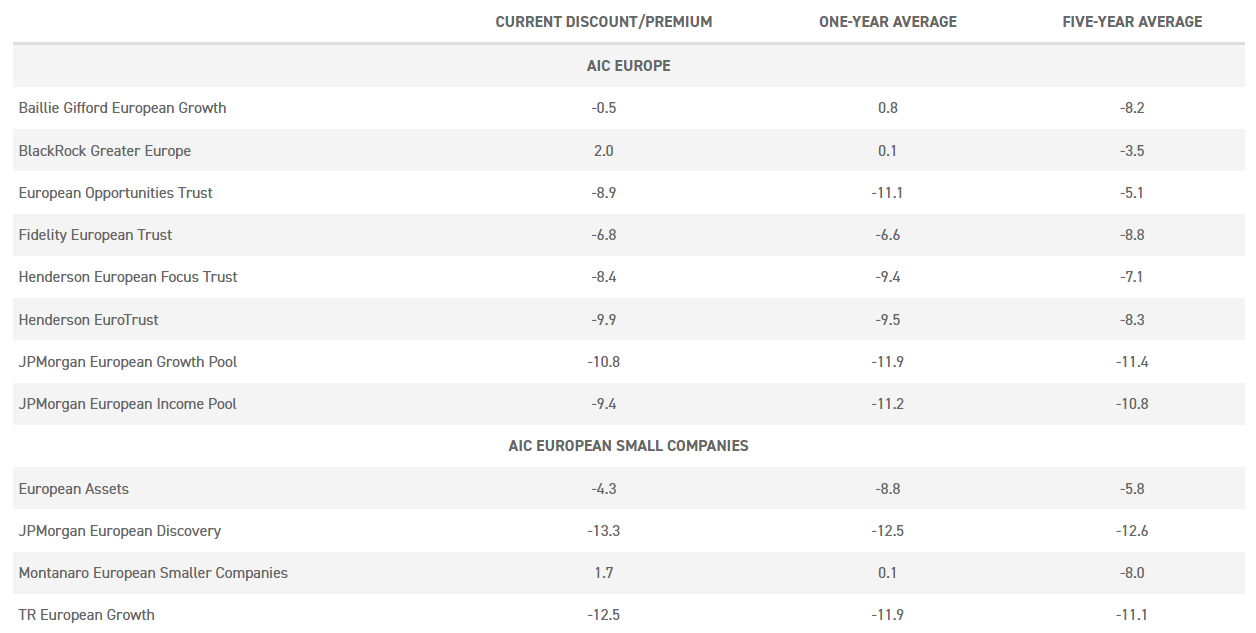
While the recent performance of European equities has certainly been attractive, their discounts have remained wide. As can be seen from the below table, the majority of trusts currently trade on a discount, with five trading on a discount wider than their average for the last 12 months, despite the recent strong performance.
Source: Morningstar
Past performance is not a reliable indicator of future returns
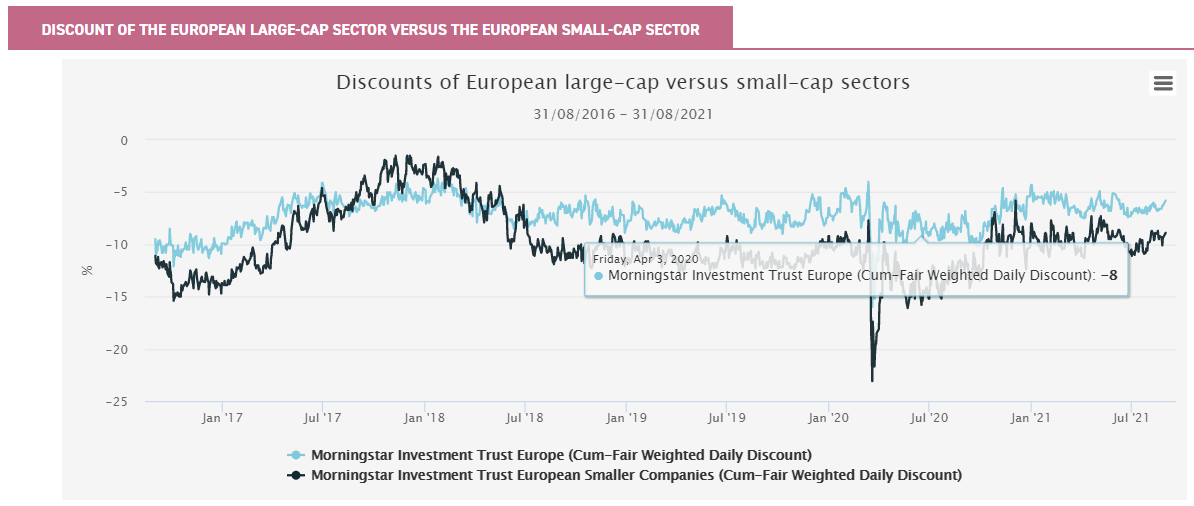
The persistent discounts of many of the trusts in the AIC’s European sectors may partially be the result of its near consistent underperformance relative to its North American peer, with it perhaps becoming harder to justify ownership of a region which consistently lags its developed market equivalents. Yet if relative performance is the driver, then that does not fully explain why European small caps trade at a largely consistent discount to European large caps, given their superior long-term track record.
It is likely that Europe’s relatively poor performance may also have been compounded by investors’ general lack of awareness about the region, with many investors likely assuming Europe’s weak economic growth has spilt over into its broader equity markets. At the time of writing, only two European trusts currently trade on a premium: BRGE and Montanaro European Smaller Companies (LSE:MTE).
We believe that these two trusts are able to command their current premiums through their sector-leading long-term performance, with both using their current premiums as an opportunity to issue equity.
Source: Morningstar
Past performance is not a reliable indicator of future returns
Discounts do create opportunities, however, and we believe that HNE’s and JEDT’s discounts are interesting. In the case of HNE, its discount has floated around the 9% mark since 2019, likely reflecting the ‘new manager’ risk that the change in its management brought about that year.
Given the long-term strength of the strategy and the fact that its manager, Jamie Ross, who will soon pass his three-year anniversary as portfolio manager in February 2022, recent pressure on its share price may offer an attractive entry point. JEDT, on the other hand, is more straightforward, as its five-year NAV return has lagged its wider peer group, likely leading to it having the widest discount in the sector. Yet as can be seen by its recent performance, it is more than able to keep up with its peers. This means that investors in JEDT get a powerful combination of competitive performance in the recent market environment plus the potential narrowing of a 13% discount.
Outlook and conclusion
The question investors must now ask themselves is whether Europe can continue its recent momentum, or whether it will simply return to its old trends once global economies normalise. While the large majority of European trusts follow a wholly bottom-up approach to investing, strategies like Henderson European Focus Trust (LSE:HEFT) incorporate macro factors into their investment process.
The HEFT team are currently bullish on the outlook for Europe, believing that there will be sustained economic growth within the region, with the European Central Bank predicting the eurozone to have a 4.5% GDP growth rate in 2022, having grown by 4.8% in 2021. The HEFT team also believe that Europe’s roster of global consumer businesses is well placed to capitalise on the rise of global consumer spending as economies reopen, with consumer discretionary being the largest sectoral weighting for the trust (LVMH and Adidas are counted amongst its top ten holdings).
However, the team remains cautious about the rise in European inflation resulting from the rise in economic output, as well as being cautious about the current supply chain bottlenecks.
Inflation was once a diminishing risk factor in Europe, with the eurozone economy having rarely hit its target 2% inflation rate in the last ten years, going as far as to report deflation in 2015 and 2016. Inflation is now back in vogue, though, with the region having just hit a decade-high 3% inflation rate.
Inflation also brings with it a potential rise in interest rates, assuming it becomes a sustained trend. While a 3% inflation rate is, in the context of the eurozone’s history, not the end of the world, a more restrictive monetary policy regime from the European Central Bank may be more damaging.
Europe, like America, has been following a regime of ultra-loose monetary policy, leading to increasingly ‘long duration’ trades. While Europe is not as valuation-sensitive as the US given its lower price multiples, inflation and interest risks are nonetheless a risk factor for European investors.
Restrictive monetary policy is something which Alexander Darwall, the manager of European Opportunities Trust (LSE:JEO), is acutely aware of, believing that the era of ‘free money’ is bound to end at some point, with Alexander avoiding highly leveraged companies as a result.
Thankfully strategies like JEO and HNE offer some protection against a rising rate environment, in part due to their overweight to financials, as financial services firms often benefit from both rising economic activity and interest rates. JEO’s performance over the past six months has been strong, with the trust only trailing BRGE and BGEU. Its current overweight to both technology and financials has allowed it to also capitalise on both the recent value and growth rallies in Europe. Yet JEO still remains on one of the wider discounts in the sector. Alexander’s focus on company fundamentals and long-term investing has led to the trust outperforming in 17 of the 20 years since its inception.
Beyond rising GDP and inflation rates, Europe’s future looks rosy, and there has been an increasingly concerted effort by the EU to drive forward an agenda of a more sustainable European economy. Not only is a third of the European recovery fund dedicated to sustainable initiatives, but Europe continues to flesh out its new ‘Green Deal’, with the intention of aligning climate, energy, transport and taxation to reduce net greenhouse gas emissions by at least 55% by 2030.
The EU has gone as far as to set the lofty goal of Europe becoming the world’s first climate-neutral continent by 2050. While the demand for renewable alternatives is clear, thanks to the direction of fiscal stimulus there may be the capacity to fulfil it, bringing with it a host of opportunities within Europe’s renewables sector.
Strategies like JEDT are already actively positioning around the opportunities in European renewable energy, although the trust’s managers highlight the stretched valuations certain companies are trading on thanks to the flurry of interest in the sector.
Europe has been able to navigate the last 12 months relatively well, having finally closed the performance gap between it and its American cousin. Yet the performance of large-cap European trusts has not been consistent. Although cyclical and value stocks were able to capitalise on the resurgent economic activity, it would once again be growth-focussed strategies which took the crown over the whole period. The European small-cap market had a more balanced performance, however, as the rising tide lifted all ships, with every small-cap trust outperforming the wider market.
Despite the strength of Europe, the discounts of European equity trusts remain wide, a hangover from investors’ past disdain for the region. Europe’s outlook remains bullish, though, with strong predictions of GDP growth, opportunities to capitalise on global consumption increases, and policymakers supportive of Europe’s transition to a sustainable economy. Hopefully the combination of recent performance and an optimistic outlook will be the signal investors have been waiting for to jump back in.
Kepler Partners is a third-party supplier and not part of interactive investor. Neither Kepler Partners or interactive investor will be responsible for any losses that may be incurred as a result of a trading idea.
These articles are provided for information purposes only. Occasionally, an opinion about whether to buy or sell a specific investment may be provided by third parties. The content is not intended to be a personal recommendation to buy or sell any financial instrument or product, or to adopt any investment strategy as it is not provided based on an assessment of your investing knowledge and experience, your financial situation or your investment objectives. The value of your investments, and the income derived from them, may go down as well as up. You may not get back all the money that you invest. The investments referred to in this article may not be suitable for all investors, and if in doubt, an investor should seek advice from a qualified investment adviser.
Full performance can be found on the company or index summary page on the interactive investor website. Simply click on the company's or index name highlighted in the article.
Important Information
Kepler Partners is not authorised to make recommendations to Retail Clients. This report is based on factual information only, and is solely for information purposes only and any views contained in it must not be construed as investment or tax advice or a recommendation to buy, sell or take any action in relation to any investment.
This report has been issued by Kepler Partners LLP solely for information purposes only and the views contained in it must not be construed as investment or tax advice or a recommendation to buy, sell or take any action in relation to any investment. If you are unclear about any of the information on this website or its suitability for you, please contact your financial or tax adviser, or an independent financial or tax adviser before making any investment or financial decisions.
The information provided on this website is not intended for distribution to, or use by, any person or entity in any jurisdiction or country where such distribution or use would be contrary to law or regulation or which would subject Kepler Partners LLP to any registration requirement within such jurisdiction or country. Persons who access this information are required to inform themselves and to comply with any such restrictions. In particular, this website is exclusively for non-US Persons. The information in this website is not for distribution to and does not constitute an offer to sell or the solicitation of any offer to buy any securities in the United States of America to or for the benefit of US Persons.
This is a marketing document, should be considered non-independent research and is subject to the rules in COBS 12.3 relating to such research. It has not been prepared in accordance with legal requirements designed to promote the independence of investment research.
No representation or warranty, express or implied, is given by any person as to the accuracy or completeness of the information and no responsibility or liability is accepted for the accuracy or sufficiency of any of the information, for any errors, omissions or misstatements, negligent or otherwise. Any views and opinions, whilst given in good faith, are subject to change without notice.
This is not an official confirmation of terms and is not to be taken as advice to take any action in relation to any investment mentioned herein. Any prices or quotations contained herein are indicative only.
Kepler Partners LLP (including its partners, employees and representatives) or a connected person may have positions in or options on the securities detailed in this report, and may buy, sell or offer to purchase or sell such securities from time to time, but will at all times be subject to restrictions imposed by the firm's internal rules. A copy of the firm's conflict of interest policy is available on request.
Past performance is not necessarily a guide to the future. The value of investments can fall as well as rise and you may get back less than you invested when you decide to sell your investments. It is strongly recommended that Independent financial advice should be taken before entering into any financial transaction.
PLEASE SEE ALSO OUR TERMS AND CONDITIONS
Kepler Partners LLP is a limited liability partnership registered in England and Wales at 9/10 Savile Row, London W1S 3PF with registered number OC334771.
Kepler Partners LLP is authorised and regulated by the Financial Conduct Authority.