Wall Street suffers misery as oil prices bubble
3rd March 2022 07:27
by Alistair Strang from Trends and Targets
He discussed in January the possibility of US stocks falling sharply. They did. Now independent analyst Alistair Strang revisits the chart and also looks at forecasts for the oil price.

Every now and then, we gleefully jump at the chance to ridicule chart patterns, often a part of a core belief structure for some traders. In fact, if were were to create a Top 3 of things which do not work for analysis, Moving Averages is #1, Candlestick patterns is #2 with Chart Patterns tying for second place. To be blunt, most technical indicators are a complete waste of space unless the trader understands how to “tune” an indicator against historical price behaviour for any specified item.
Unfortunately, in most internet chatrooms, folks will enthuse about what ‘MacD’ points toward, completely unaware the default set of averages supplied for a ‘MacD’ shall be completely wrong unless, by some miracle, they’re discussing a share at the market average price, historically making completely average movements. When you pause to consider this, it should be quickly realised the average share simply doesn’t exist.
- Why reading charts can help you become a better investor
- Friends & Family: ii customers can give up to 5 people a free subscription to ii, for just £5 a month extra. Learn more
However, we’ve often a problem with Tom Bulkowski’s Head & Shoulders chart pattern, because it sometimes works. Basically, the pattern breaks down into a series of emotions, especially against something turbulent.
- We’re all confident, it’s going up.
- Okay, that’s far enough. I’m taking profit and bailing. The price drops.
- Hey, that share had dropped sharply. Think I’ll jump in.
- Look, we’ve just passed the previous high. I’m out of here. The price drops.
- Hey, that share had dropped sharply. Think I’ll jump in.
- Feels like it’s struggling to match the first high price. I’m nervous and getting out. The price drops.
- Look at that share. It can’t even reach the level of previous highs. I’m not touching it. The price drops further.
This trading cycle combines to produce the classic Head & Shoulder pattern and, when you combine the emotions with the rollercoaster, everything starts to make a grudging sense.
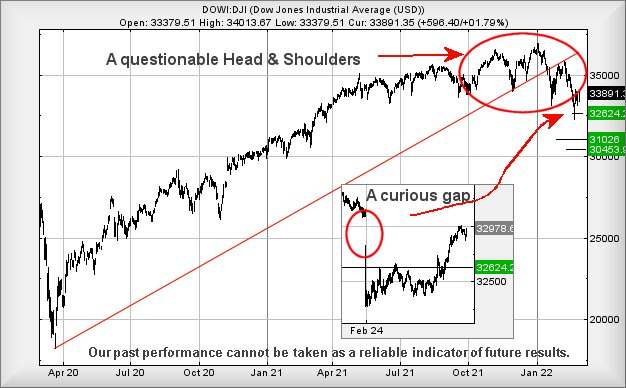
Unfortunately, when looking at Wall Street currently, the index is setting itself up for a bit of a Head & Shoulders moment and we worry about how far the dandruff risks dropping.
Our own take on the situation was given in January when we supplied criteria for reversal from 34,525 to 32,624 points, a drop of 1,901 points. This movement completed at the end of February and, crucially, the index failed to close the session below our target level. As a result – from our perspective – the final nail remains absent from the Head & Shoulders coffin which is lurking against the Dow Jones.
- Could the S&P 500 really fall 20%
- Friends & Family: ii customers can give up to 5 people a free subscription to ii, for just £5 a month extra. Learn more
The immediate situation (with Wall Street trading around 33,880 at time of writing) demands the index weaken below 33,090 to enter a cycle which threatens reversal to an initial 31,026 points.
Our secondary is relatively close by, lurking at 30,453 and creating a suggestion of a bounce, should such a level appear. Even visually, this would make some sense. To cancel our gloomy outlook, Wall St requires trade above 34,885 points currently.

Source: Trends and Targets. Past performance is not a guide to future performance
Finally, something quite curious occurred the day the market hit and broke our 32,624 target level. We’ve shown it on the chart inset above but, basically, the only reason our target level broke was thanks to Wall Street being “gapped down” at the open on the 24 February. Go figure!
Oil

Source: Trends and Targets. Past performance is not a guide to future performance
As for Brent crude, we’ll keep it short and sharp, thanks to the inspired essay above!
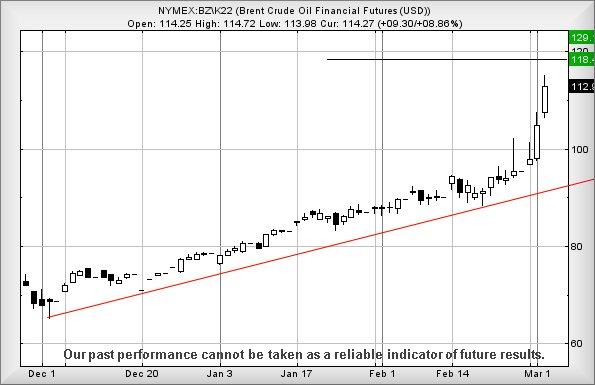
The oil market has been showing some impressive high prices and it appears they are close to running out of steam. For Brent crude, now above $114.80 looks capable of attempting an initial $118.4 next.
Should this level be exceeded, our secondary calculation works out at $129.1 and, we expect, some volatility at such a level. To be blunt, it seems now isn’t the time to rush and open a short as there’s the potential of further growth for the black stuff.
Alistair Strang has led high-profile and "top secret" software projects since the late 1970s and won the original John Logie Baird Award for inventors and innovators. After the financial crash, he wanted to know "how it worked" with a view to mimicking existing trading formulas and predicting what was coming next. His results speak for themselves as he continually refines the methodology.
Alistair Strang is a freelance contributor and not a direct employee of Interactive Investor. All correspondence is with Alistair Strang, who for these purposes is deemed a third-party supplier. Buying, selling and investing in shares is not without risk. Market and company movement will affect your performance and you may get back less than you invest. Neither Alistair Strang or Interactive Investor will be responsible for any losses that may be incurred as a result of following a trading idea.
These articles are provided for information purposes only. Occasionally, an opinion about whether to buy or sell a specific investment may be provided by third parties. The content is not intended to be a personal recommendation to buy or sell any financial instrument or product, or to adopt any investment strategy as it is not provided based on an assessment of your investing knowledge and experience, your financial situation or your investment objectives. The value of your investments, and the income derived from them, may go down as well as up. You may not get back all the money that you invest. The investments referred to in this article may not be suitable for all investors, and if in doubt, an investor should seek advice from a qualified investment adviser.
Full performance can be found on the company or index summary page on the interactive investor website. Simply click on the company's or index name highlighted in the article.