Three US funds providing consistent returns
Saltydog Investor identifies funds that have delivered gains of 5% or more in five of the past six six-month periods.
18th February 2025 09:58
by Douglas Chadwick from ii contributor

This content is provided by Saltydog Investor. It is a third-party supplier and not part of interactive investor. It is provided for information only and does not constitute a personal recommendation.
At Saltydog Investor, we pride ourselves on providing data-driven insights to help DIY investors navigate the ever-changing fund landscape.
While our primary focus is on short-term trends, ranging from one week to six months, we also recognise the value of identifying funds that demonstrate strong and sustained performance over a longer time frame. That is why, every three months, we conduct our in-depth “6x6” analysis.
- Invest with ii: Buy Global Funds | Top Investment Funds | Open a Trading Account
This is when we trawl through our fund data looking for funds that have consistently achieved gains of 5% or more in each of the past six six-month periods. It’s a tough challenge, but we do occasionally find a few funds that make the grade.
Our latest analysis covers the three years from February 2022 to the end of last month. On this occasion, no funds achieved the full six out of six, but we did identify a select group that came very close. Nine funds met the 5% target in five out of six periods. Two of these were offshore funds, and of the seven UK-domiciled funds, three belonged to the North America sector, two to Global Equity Income, one to the Japanese sector, and one to UK All Companies.
Below is a breakdown of these top-performing funds and their returns over each six-month period.
Saltydog Investor 6x6 Report February 2025
| Investment Association sector | Feb 22 to July 22 | Aug 22 to Jan 23 | Feb 23 to July 23 | Aug 23 to Jan 24 | Feb 24 to July 24 | Aug 24 to Jan 25 | 3-yr return | |
| Funds that have risen by 5% or more in five out of six periods | ||||||||
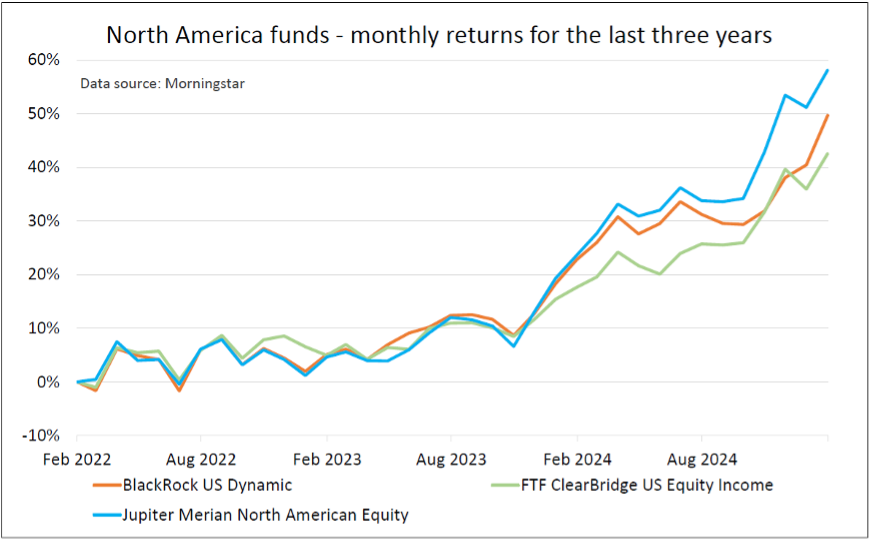
| Jupiter Merian North American Equity | North America | 6.1% | -1.4% | 7.1% | 10.4% | 8.2% | 18.2% | 58% |
| BlackRock US Dynamic | North America | 6.0% | -0.9% | 6.9% | 9.2% | 6.9% | 14.0% | 50% |
| FTF ClearBridge US Equity Income | North America | 5.9% | -0.9% | 5.7% | 6.0% | 6.9% | 13.4% | 43% |
| Invesco Global Equity Inc | Global Equity Income | 1.5% | 6.9% | 7.7% | 7.3% | 8.9% | 11.8% | 53% |
| WS Guinness Global Equity Income | Global Equity Income | 6.0% | -0.1% | 6.6% | 5.7% | 8.8% | 8.2% | 40% |
| CT Japan | Japan | -7.9% | 8.3% | 5.1% | 10.2% | 7.3% | 6.5% | 32% |
| Ninety One UK Special Situations | UK All Companies | -7.8% | 11.2% | 5.3% | 11.9% | 19.1% | 5.9% | 52% |
Past performance is not a guide to future performance.
The top three funds were all from the North America sector, which requires funds to “invest at least 80% of their assets in North American equities”.
On the face of it, you might think that North America could include quite a wide range of countries. The three largest are usually considered to be Canada, Mexico and the US. If you include Central America and Caribbean islands, you end up with more than 20 countries. However, the Investment Association (IA) definition is more constrained, and categorises the North America sector as “funds predominantly investing in the US and Canada”.
They go on to say that “a fund that invests solely in Canada will be classified to the Specialist sector as it is not sufficiently diversified to qualify as a North American fund; conversely a US-focused fund may be classified to the North America sector as it can be expected to be sufficiently diversified”.
What that means, in practice, is that most funds in the North America sector are very heavily weighted towards the US. From the list above, Jupiter Merian North American Equity I GBP Acc and FTF ClearBridge US Equity Income W Acc have less than 3% invested in Canada, while BlackRock US Dynamic D Acc doesn’t hold any North American investments outside the US.
That is not necessarily a bad thing, as US stock markets have performed well over the past couple of years. However, they are reliant on the large technology companies, which are looking increasingly expensive and vulnerable to a market correction.
- Watch our video:Gervais Williams: US tech could fall a long way
- Why concentration risk is a problem for many investors
- Sign up to our free newsletter for investment ideas, latest news and award-winning analysis
We saw an example of this last month when it emerged that the DeepSeek AI chatbot, developed by a 2023 start-up in China, had apparently been launched for a fraction of the cost of its Western rivals. It used much cheaper semiconductors, consumed less energy, required less processing power, and was said to be just as effective.
NVIDIA Corp (NASDAQ:NVDA), the US microchip manufacturer that had just overtaken Apple Inc (NASDAQ:AAPL) to become the world's most valuable company, saw almost $600 billion (£475 billion) wiped off its market value - the largest single-day drop in US stock market history. The Nasdaq dropped by 3% in one day.
It caused a media frenzy, and there were plenty of headlines framing it as the beginning of a major global market sell-off. However, many were somewhat exaggerated, and markets recovered. We may not be so lucky next time.
- Why it’s not over for Nvidia or these mega-cap tech stocks
- 10 funds to generate a £10,000 income in 2025
What it also highlights is that the growth of US stock markets have become very reliant on a small number of companies.
Last year the North America sector, as a whole, went up by 22%, and was only beaten by the Technology & Technology Innovation and Financials & Financial Innovation sectors. However, it was not all plain sailing. During the year there were three months when it went down. In April, it fell by -3.1%, in July it lost -0.3%, and in December it finished the month down -2.3%. It also failed to make a gain over the whole of the third quarter.
You have only got to go back to 2022, and the sector made a one-year loss of -10.1%.
With this level of volatility, it is not difficult to see why so few funds in this sector have managed to deliver consistently on consecutive six-month periods.
While some funds may have delivered higher overall returns over the past three years, for investors seeking exposure to the North America sector with a focus on consistent growth, these three funds must be worth considering.
Past performance is not a guide to future performance.
For more information about Saltydog, or to take the two-month free trial, go to www.saltydoginvestor.com
These articles are provided for information purposes only. Occasionally, an opinion about whether to buy or sell a specific investment may be provided by third parties. The content is not intended to be a personal recommendation to buy or sell any financial instrument or product, or to adopt any investment strategy as it is not provided based on an assessment of your investing knowledge and experience, your financial situation or your investment objectives. The value of your investments, and the income derived from them, may go down as well as up. You may not get back all the money that you invest. The investments referred to in this article may not be suitable for all investors, and if in doubt, an investor should seek advice from a qualified investment adviser.
Full performance can be found on the company or index summary page on the interactive investor website. Simply click on the company's or index name highlighted in the article.