Ted Baker: A contrarian trade?
5th December 2018 08:55
by Alistair Strang from Trends and Targets
Founder and CEO of this mid-cap fashion chain Ray Kelvin is in the news for all the wrong reasons, sending Ted Baker shares below the uptrend since 2009. Chartist Alistair Strang assesses possible outcomes.

Ted Baker (LSE:TED)
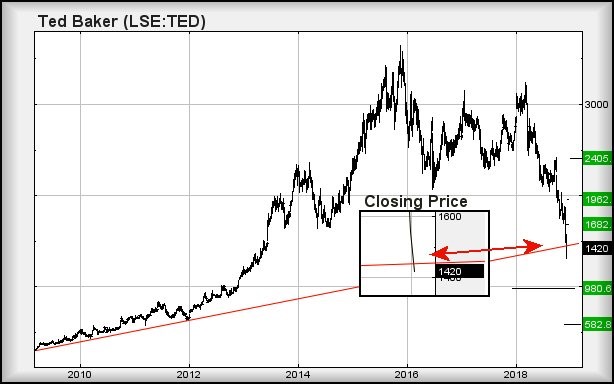
Ted Baker has a bit of a problem. With the share price recently carrying out experiments with gravity (gravity won!) it finds itself in the unenviable position of closing below the uptrend since 2009. We're not yet convinced it has kicked open the gates of hell though.
First, there's the problem at 1,370p. To convince it was entering a fairly serious drop cycle, the price needed actually to close a session below 1,370p. As it completed the session on the fourth at 1,420p, despite an intraday low of 1,312p, it fails to tick this particular box.
However, there's instead the "threat" of any trend break shall prove short lived with a miracle recovery ensuing.
Moreover, there is a very real risk of traffic now below 1,312p allowing for travel down to an initial 980p. If broken, secondary calculates at 582p.
The interesting thing about the secondary is it's the lowest we can calculate. Quite literally, we cannot compute anything sane below this level - quite a high number in the grand scheme of things and one which probably reflects the esteem the market holds the company in.
Should we take the stance of the trend break proving a mistake, the price need only better 1,470p to enter a near term cycle to a useless 1,509p. The key element about such a target will be, if bettered, there's a good chance it has bottomed for now, thus allowing for 1,682p.
At the 1,682p level, things become really strange with a taste of "gotcha, suckers". Essentially anything beyond such a level looks like entering a longer term cycle to 24 quid.
For now, as the chart inset shows, it's in dangerous territory but despite opportunity, has not yet confirmed a readiness to fall.

Source: Trends and Targets Past performance is not a guide to future performance
Alistair Strang has led high-profile and "top secret" software projects since the late 1970s and won the original John Logie Baird Award for inventors and innovators. After the financial crash, he wanted to know "how it worked" with a view to mimicking existing trading formulas and predicting what was coming next. His results speak for themselves as he continually refines the methodology.
Alistair Strang is a freelance contributor and not a direct employee of Interactive Investor. All correspondence is with Alistair Strang, who for these purposes is deemed a third-party supplier. Buying, selling and investing in shares is not without risk. Market and company movement will affect your performance and you may get back less than you invest. Neither Alistair Strang or Interactive Investor will be responsible for any losses that may be incurred as a result of following a trading idea.
These articles are provided for information purposes only. Occasionally, an opinion about whether to buy or sell a specific investment may be provided by third parties. The content is not intended to be a personal recommendation to buy or sell any financial instrument or product, or to adopt any investment strategy as it is not provided based on an assessment of your investing knowledge and experience, your financial situation or your investment objectives. The value of your investments, and the income derived from them, may go down as well as up. You may not get back all the money that you invest. The investments referred to in this article may not be suitable for all investors, and if in doubt, an investor should seek advice from a qualified investment adviser.
Full performance can be found on the company or index summary page on the interactive investor website. Simply click on the company's or index name highlighted in the article.