Stockwatch: why the market rebound could be a ‘bull trap’
Edmond Jackson explains why investor confidence could be misplaced, and uses three charts to make his case.
20th August 2024 11:03
by Edmond Jackson from interactive investor

As central bankers prepare to gather from Thursday at Jackson Hole, Wyoming, markets are once again buoyed by optimism about how interest rates will be managed down. The proverbial “soft landing” to be achieved, with inflation nearing 2% target and recession averted.
It is also hoped minutes of the US Federal Reserve’s 30-31 July meeting will affirm such a scenario.
Yet after the US market enjoyed its strongest week of 2024, one “tail-end risk” hedge fund manager challenged this assumption last weekend. Since his fund’s strategy is effectively to offer insurance against a market slide, we can expect negativity. But when a consensus is firm I like to check out a lone voice.
- Invest with ii: Investing in Bonds | What is a Managed ISA? | Open a SIPP
A bull trap in the latest market rebound?
Mark Spitznagel, the 53-year-old founder and chief investment officer of Universa Investments, argues the whipsaw sentiment in US stocks this month is symptomatic of nearing a major peak – and reversal.
Latest data from Deutsche Bank suggests investors who slashed exposure to equities in early August, have piled back in. Indeed, one I know sold half his Nvidia Corporation NVDA but re-invested in a spread of growth plays, explaining such trades before the market fell then rose.
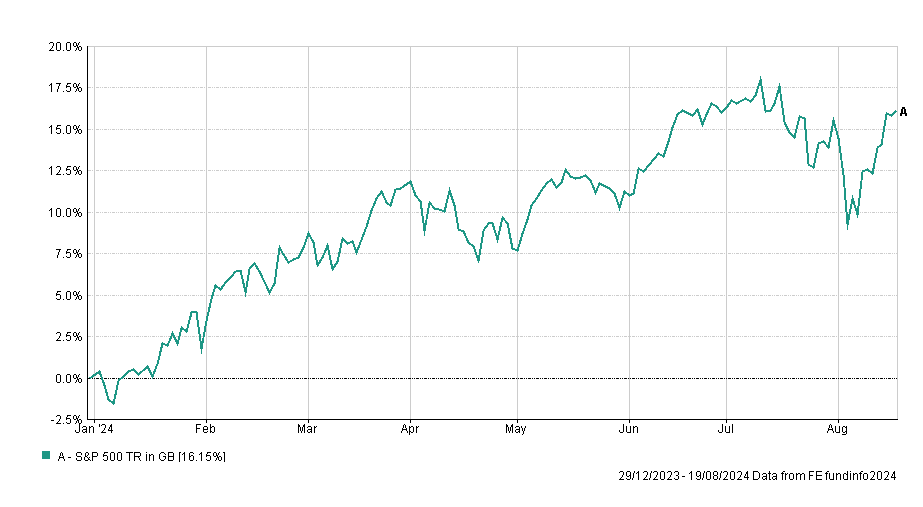
Spitznagel argues, such a snap-back in optimism is a bull trap, with the caveat how prices could still continue to rise in the short term. I would certainly prefer to see an S&P 500 chart more akin to a “head and shoulders” than what appears re-affirmation of an uptrend:

Source: FE Analytics, 20/08/24
His claim to credulity is having successfully exploited the 2008 crisis also early 2020 Covid panic, it is impossible now to verify although mainstream financial media affirmed so at the time. That does imply adept perception of change, and fund positioning to capitalise; where “tail-end risk hedging” techniques employed, such as with put options. These are impractical for the vast majority of private investors hence the main intrigue is why should Spitznagel stick his neck out now, challenging this rebound?
- DIY Investor Diary: becoming an ISA millionaire was like completing a marathon
- DIY Investor Diary: how my ISA and SIPP are invested differently
Confidence, an inverted yield curve presages recession
Spitznagel maintains the current perverse relation in government bonds yields will herald recession.
Normally, you would expect longer-dated debt to command a higher return due to greater uncertainty in the future. But when returns on short-dated bonds - typically three-months to maturity – exceed those on 10-year it implies greater risk near-term.
I have some conceptual difficulty swallowing this, since bond pricing largely reflects market expectations than the underlying economy as expressed by gross domestic product, retail sales and so on. The late Professor Paul Samuelson quipped, even over 40 years ago, “the stock market has predicted nine out of the last five recessions”.
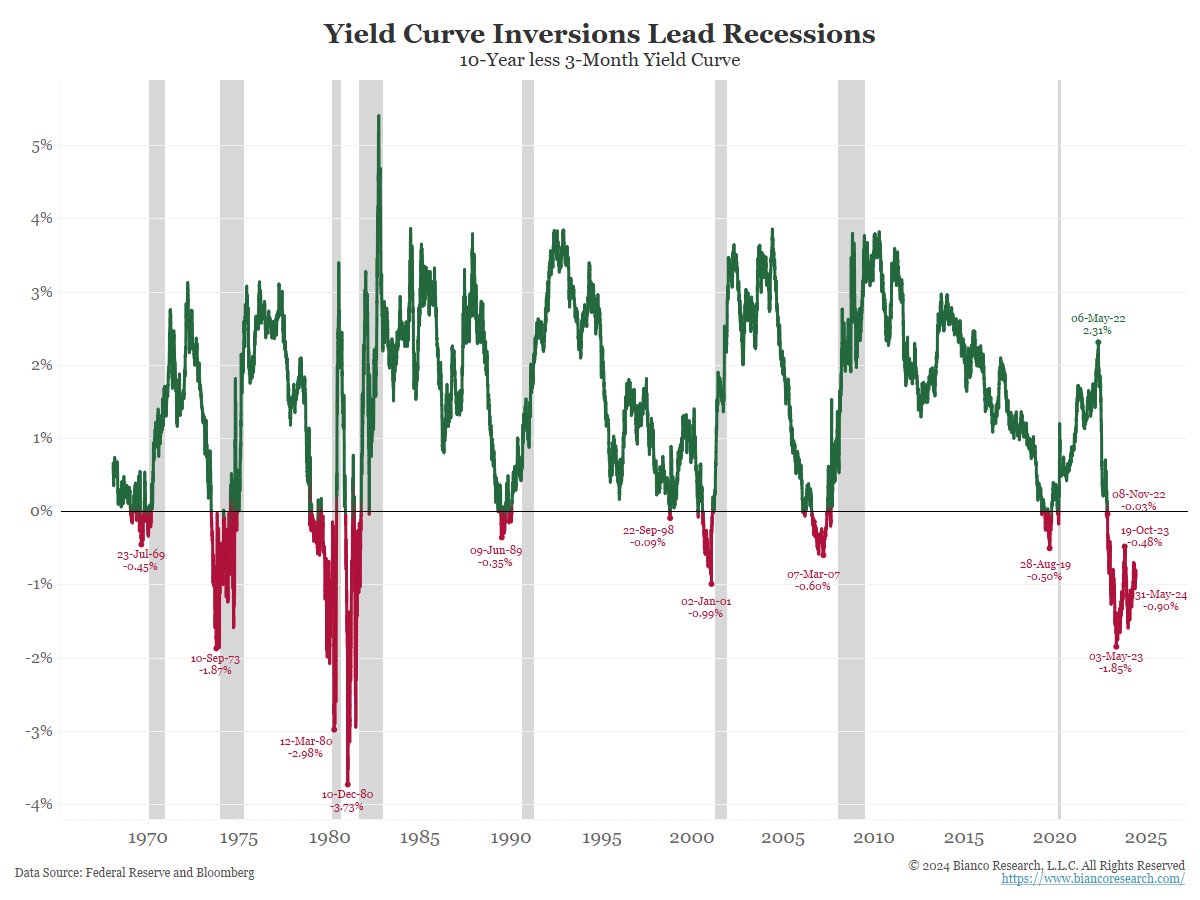
The bond market is supposedly wiser. It is indeed hard to argue with data showing each of the last eight US recessions going back to the 1960’s, occurred after the yield on the 10-year Treasury bond yield fell below the three-month.

Source: Bianco Research on X
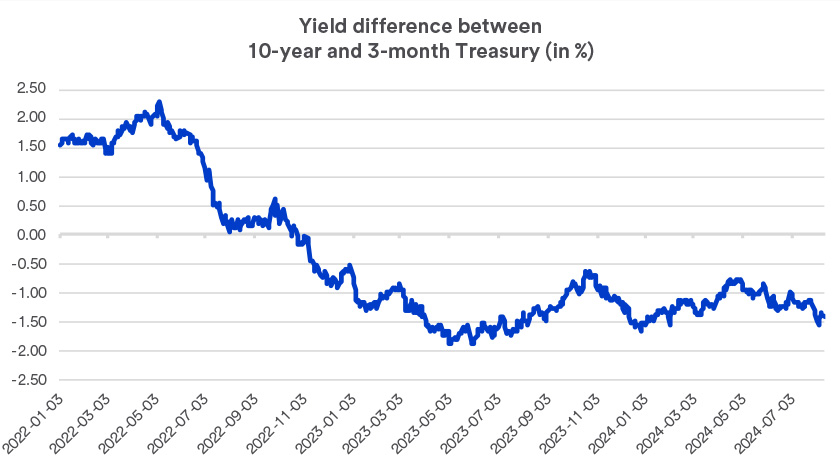
Yet in the last 20 or so months since the US yield curve inverted, there has been no sufficient evidence to constitute recession. An overall downward-sloping yield curve remains despite the highest inflation and aggressive interest rate rising cycle in 40 years.

Source: Federal Reserve Bank of St Louis

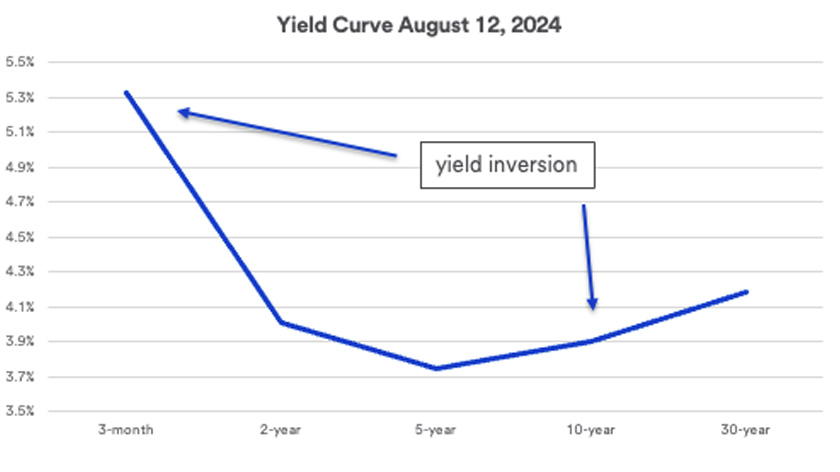
Source: US Treasury Department
It is harder to access such charts for the UK but currently there is only a minor 0.2% spread between the yields on two-year and 10-year government bonds. Our yield curve essentially normalised from last July but given it followed the global pattern by way of inverting from mid-2022, we did of course see a technical UK recession in the fourth quarter of 2023.
So far as asset allocation is concerned, however, fearing the yield curve could have kept you out of equities at end-2023 which was some buying opportunity within their uptrend since early 2009.
‘Disinversion’ is supposedly what matters
Spitznagel argues, what is crucial is (effectively) what we see in the UK now: when the yield curve returns to normal. The logic behind this is short-dated bond yields falling as the central bank cuts interest rates to counter economic or market stress.
US data shows an average 334 days to recession manifesting, from the three-month/10-year curve initially inverting, albeit only an average 66 days from when the curve disinverts.
Jim Bianco, who leads a team of macro analysts in Chicago, is behind this research, although for the US he last posted on X on 1 June saying: “To be clear, the yield curve is not close to inverting.”
So I question where is Spitznagel’s evidence when he cites the US yield curve’s “current disinversion trend” signals a recession is coming and likely this year.
Possibly there are signs within short-dated US bonds, of some yields falling – the effect of bond prices rising, in expectation the Fed will start cutting interest rates very soon. But I do not see how the US yield curve has normalised like it has in the UK.
- How professional investors reacted to market turbulence
- Benstead on Bonds: stock market wobble shows why we own bonds
Extent of debt limits future attempts at economic stimulus
I respect Spitznagel’s caution how global debt and its relation to GDP continues to soar. In the first quarter of 2024, US non-financial corporations had a record $13.7 trillion (£10.6 trillion) debt and total global debt – mostly governmental - was a record $315 trillion. US national debt constitutes $35 trillion and is projected to reach 116% of gross domestic product by 2034, versus a 106% high during the Second World War.
Soaring government debts make it harder for new large-scale spending programmes to rescue economies. Already we see a reality check in the UK, how Labour is reining back on its “go for growth” mantra during the general election and is cancelling some major infrastructure projects. It blames a “black hole” of stretched public finances.
Fears of a crash over 50% are misplaced
I can respect Spitznagel’s case how monetary stimulus by central banks went on for too long than was justified by the 2008 crisis; and both the monetary and fiscal response to Covid was excessive and contributed to bubble valuations in some areas of the US stock market.
But I depart from his sense how "the biggest bubble in financial history" implies an equal and opposite reaction on the downside.
Recession would need to be fierce to compromise dividend yields, yet are likely to become more attractive in 2025 as interest rates steadily fall. A crash would be seized by long-term institutional investors who predominate versus over-leveraged individuals back in the Wall Street of 1929.
A vigorous private equity industry is short on projects for its cash available, hence would pounce similarly as I recall takeovers increased in the aftermath of the 1987 crash – helping shares fully recover by mid-1988.
If examples of weakness – such as a weak US labour market indicator in early August – were to multiply then yes, US equity valuations are exposed. Mid-year, JP Morgan Research raised its probability of a US recession starting by end-2024, from 25% to 35% - leaving “by end-2025” at 45%.
But evidence of vigour such as US retail sales, continues. Data is mixed, so keep attuned to the big picture.
Edmond Jackson is a freelance contributor and not a direct employee of interactive investor.
These articles are provided for information purposes only. Occasionally, an opinion about whether to buy or sell a specific investment may be provided by third parties. The content is not intended to be a personal recommendation to buy or sell any financial instrument or product, or to adopt any investment strategy as it is not provided based on an assessment of your investing knowledge and experience, your financial situation or your investment objectives. The value of your investments, and the income derived from them, may go down as well as up. You may not get back all the money that you invest. The investments referred to in this article may not be suitable for all investors, and if in doubt, an investor should seek advice from a qualified investment adviser.
Full performance can be found on the company or index summary page on the interactive investor website. Simply click on the company's or index name highlighted in the article.
Disclosure
We use a combination of fundamental and technical analysis in forming our view as to the valuation and prospects of an investment. Where relevant we have set out those particular matters we think are important in the above article, but further detail can be found here.
Please note that our article on this investment should not be considered to be a regular publication.
Details of all recommendations issued by ii during the previous 12-month period can be found here.
ii adheres to a strict code of conduct. Contributors may hold shares or have other interests in companies included in these portfolios, which could create a conflict of interests. Contributors intending to write about any financial instruments in which they have an interest are required to disclose such interest to ii and in the article itself. ii will at all times consider whether such interest impairs the objectivity of the recommendation.
In addition, individuals involved in the production of investment articles are subject to a personal account dealing restriction, which prevents them from placing a transaction in the specified instrument(s) for a period before and for five working days after such publication. This is to avoid personal interests conflicting with the interests of the recipients of those investment articles.