Stockwatch: why I would buy these two infrastructure shares
In a sector of contrasting fortunes, analyst Edmond Jackson has identified a couple of companies he’d buy now while keeping a close eye on the economic outlook.
14th March 2025 11:00
by Edmond Jackson from interactive investor
Construction stocks can be a misleading term. Housebuilding and commercial property development is somewhat beleaguered just now, but the sector also includes infrastructure where healthy outlooks have just been affirmed in results from Costain Group (LSE:COST) and Kier Group (LSE:KIE).
- Invest with ii: Open an ISA | ISA Investment Ideas | Transfer a Stocks & Shares ISA
With its 2024 results, Costain has declared a near 40% jump in its “forward work”, and as soon as Kier emerged from its closed period for interim results to 31 December, four directors bought nearly £77,000 worth of shares at around 124p. The shares are currently priced at 121p.
While Costain is benefiting partly from the water industry improving quality and services, Kier “is well-positioned to continue benefiting from UK government infrastructure spending commitments”. The crux for both shares is, can low single-digit operating margins be trusted? Costain is ambitious to grow its margin above 5% - a historic breakthrough – while Kier is steady at 3.4%. To investors of long memory, the question is whether any one or few problematic contracts might compromise that.
Such concern largely explains low forward price/earnings (PE) ratios of 7x and 6x respectively, with the market also pricing Kier for a yield above 6%. Yet Costain’s share price has trebled since the disruption of the Covid years, and Kier has at least doubled:
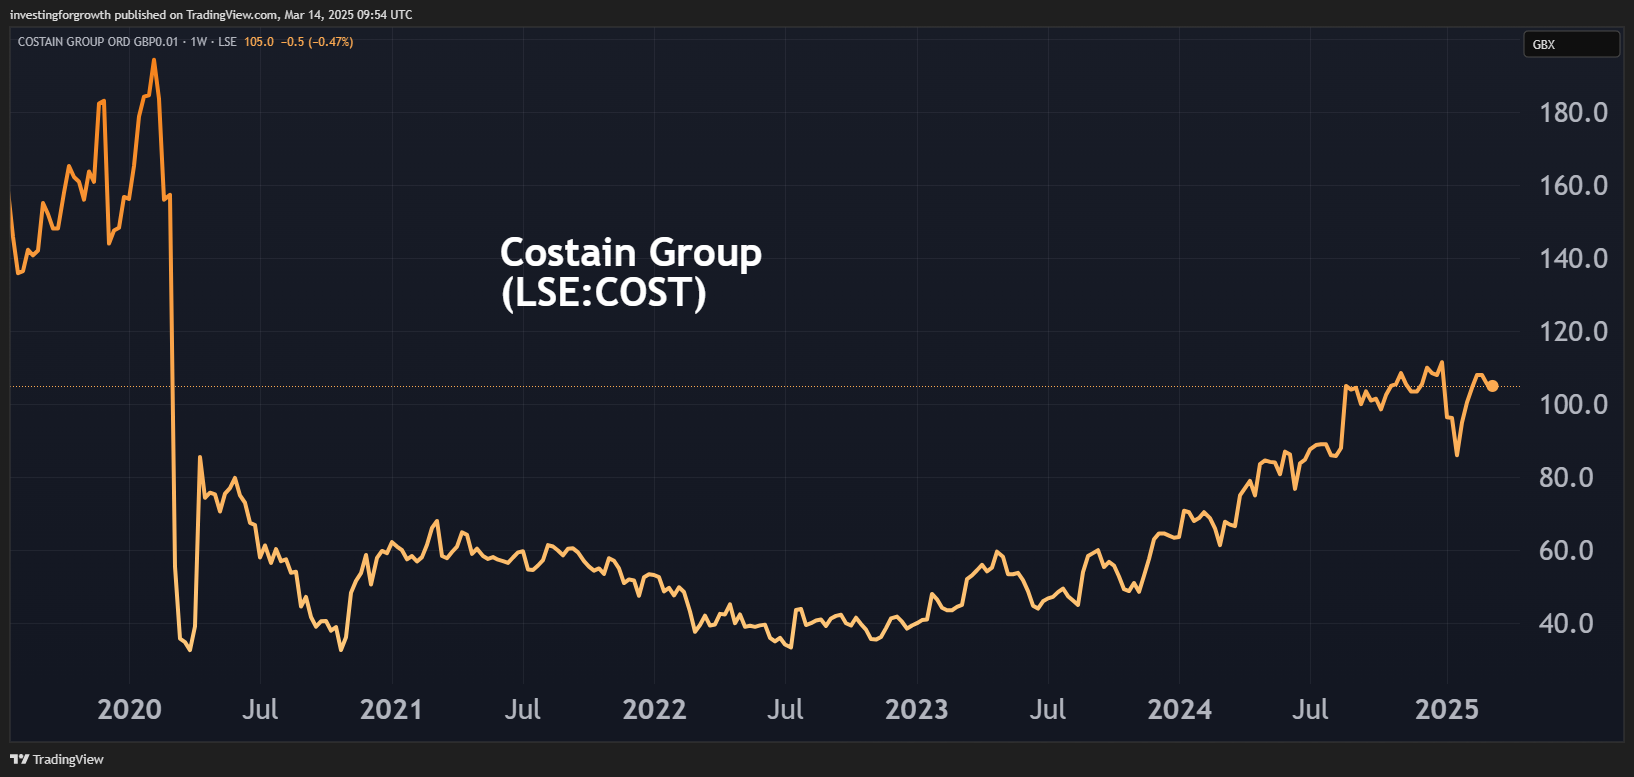
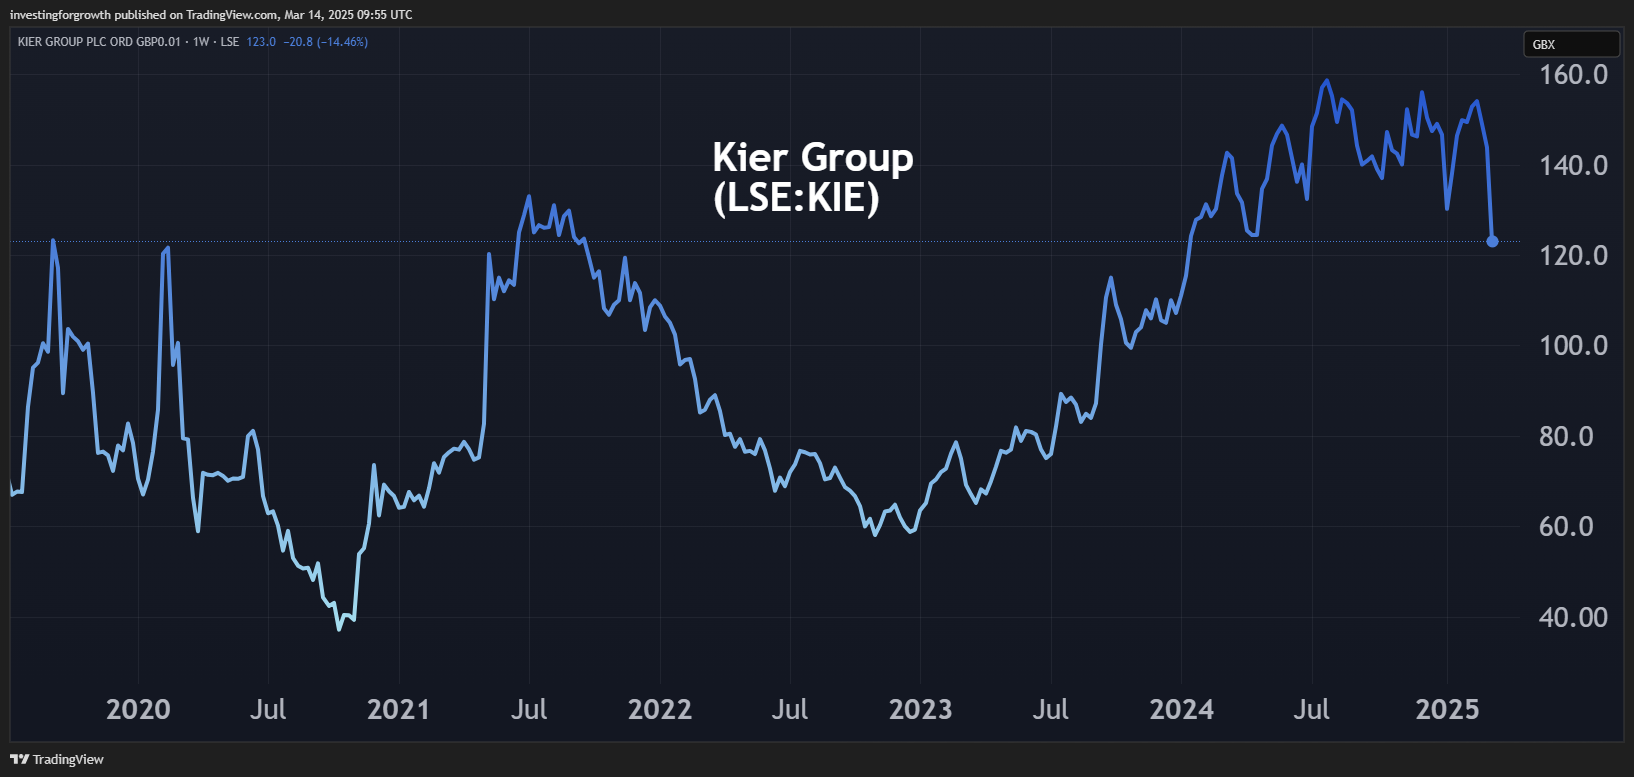
Source: TradingView. Past performance is not a guide to future performance.
A near-term challenge is the hike in employment costs from April, which may help explain post-results profit taking. Costain has more than 3,000 employees, Kier over 10,000. There is nothing in either company’s results as to how they plan to manage this despite talking about climate change and their progress to net zero.
Costain’s ‘forward work’ looks great – if a bit cute
Call me traditional but my expectation is for contractors to report work in progress – maybe referenced as backlog – and also order book. Each could have different dynamics, hence will aid understanding about whether revenues are due to rise or fall.
Costain appears to lump together both elements by way of “forward work” representing its order book and preferred bidder book “which includes revenue from contracts which are partially or fully unsatisfied...” But at least a record £1.5 billion increase to £5.4 billion – over four times 2024 revenue – says that medium-term prospects are underwritten.
- Stockwatch: a share to benefit from infrastructure spending
- Sign up to our free newsletter for investment ideas, latest news and award-winning analysis
You are therefore looking at a relative “growth” company on a cyclical-type rating, the chief risk being any project execution going awry.
This work position is not fresh news, it was flagged in a 27 January update, as was the sense of a rising operating margin by way of affirming market forecasts for a strong rise in operating profit.
Both key divisions have raised efficiency, hence the group adjusted operating margin by 40 basis points from 3.0% to 3.4% – with 4.4% achieved in the second half-year. It’s unclear whether this is seasonal or sustainable as employment costs rise, but Costain says its “transformation programme” completion puts it on track to deliver 4.5% in 2025 and targets over 5.0% thereafter.
If we accept these assurances, then combining with the revenue re-rate implies material earning power ahead.
Costain Group - financial summary
Year end 31 Dec
| 2017 | 2018 | 2019 | 2020 | 2021 | 2022 | 2023 | 2024 | |
| Turnover (£ million) | 1,684 | 1,464 | 1,156 | 978 | 1,135 | 1,421 | 1,332 | 1,251 |
| Operating margin (%) | 2.8 | 3.0 | -0.3 | -9.4 | -0.8 | 2.5 | 2.0 | 2.5 |
| Operating profit (£m) | 47.5 | 43.4 | -2.9 | -91.8 | -9.5 | 34.9 | 26.8 | 31.1 |
| Net profit (£m) | 33 | 33 | -2.9 | -78.0 | -5.8 | 25.9 | 22.1 | 30.6 |
| Reported EPS (p) | 27.1 | 26.8 | -2.4 | -36.7 | -2.1 | 9.4 | 7.8 | 11.1 |
| Normalised EPS (p) | 27.1 | 35.2 | 16.1 | -31.2 | -2.1 | 9.8 | 8.5 | 11.1 |
| Operating cashflow/share (p) | 42.8 | -39.2 | -26.5 | -22.1 | 10.7 | 5.1 | 19.7 | 15.5 |
| Capex/share (p) | 1.7 | 1.1 | 5.7 | 1.9 | 0.8 | 0.2 | 0.0 | 3.3 |
| Free cashflow/share (p) | 41.1 | -40.3 | -32.2 | -24.0 | 9.9 | 4.9 | 19.7 | 12.2 |
| Ordinary dividend per share (p) | 12.4 | 13.4 | 3.4 | 0.0 | 0.0 | 0.0 | 1.2 | 2.4 |
| Covered by earnings (x) | 2.2 | 2.0 | -0.7 | 0.0 | 0.0 | 0.0 | 6.5 | 4.6 |
| Return on total capital (%) | 19.8 | 17.5 | -1.3 | -41.1 | -3.8 | 14.9 | 11.4 | 12.4 |
| Cash (£m) | 249 | 189 | 181 | 151 | 159 | 124 | 164 | 159 |
| Net debt (£m) | -178 | -119 | -34.9 | -70.8 | -93.2 | -94.3 | -140 | -133 |
| Net assets/share (p) | 129 | 151 | 129 | 56.9 | 72.4 | 76.8 | 79.3 | 87.7 |
Source: historic Company REFS and company accounts.
Sceptics may note that while the dividend has doubled to 2.4p “as we move towards our target of three times cover” it is six times covered by the 20% advance in adjusted earnings per share (EPS) to 14.6p and costs just £6 million relative to £158 million cash. If the board is so confident in prospects, then why not return more? Yet it is relatively early days since dividends were resumed in respect of 2023, and a strong net cash position is likely a prerequisite for contracts bidding.
As for divisional performance: transportation (road, rail and integrated projects such as Heathrow redevelopment and Transport for London) represents 68% of £1,251 million group revenue, albeit down 10.4%, hence a 6.5% operating profit rise due to raising the margin 0.5% to 3.5%. The revenue is said to reflect projects completed, albeit with a good pipeline for the future.
Natural resources edged up 4.2% to 32% of total revenue, driven by defence, nuclear and water, enjoying a slight margin rise from 5.6% to 5.9% with a higher mix of consultancy.
- Housebuilders: is the worst over for these stocks?
- The Income Investor: why I’m still a buyer despite dividend cut
Net tangible assets close to £185 million, or 68.6p a share, represent decent asset-backing at the current market price of 104p.
It appears the chief risk would be a UK recession forcing an extent of slowdown despite infrastructure commitments and targets, albeit with less downside risk than other construction and cyclical shares.
I have made various “buy” cases” from 50p in March 2023 and retain this stance on the basis that if higher employment costs were so material, then management would have said so already – rather than allow consensus for 24% EPS growth this year to get established.
A big drop in Kier shares in response to results
Kier’s share price plunged from around 140p to 122p following its half-year results, then three non-executive directors including the chair and a senior manager’s partner bought shares at around 124p. The US market slump dragged the price down to 121p currently.
With a near 80% jump in earnings per share expected this financial year to 30 June, the PE is 5.7x, easing to 5.4x in 2026 – assuming net profit of £102 million. The adjusted interim operating margin of 3.4% is identical to Costain if flat like-for-like on 2023, and interim revenue/profit dynamics are unexciting so far - up 5% and 3% respectively.
But despite flat EPS of 4.6p, the interim dividend rises 20% to 2.0p, aided by a 241% jump in net cash to £58 million. With a 6.7p total dividend expected this financial year and 7.3p next, the prospective yield edges close to 6%.
Kier Group - financial summary
Year ended 30 Jun
| 2014 | 2015 | 2016 | 2017 | 2018 | 2019 | 2020 | 2021 | 2022 | 2023 | 2024 | |
| Turnover (£ million) | 2,907 | 3,276 | 3,998 | 4,112 | 4,220 | 3,966 | 3,423 | 3,261 | 3,144 | 3,381 | 3,905 |
| Operating margin (%) | 1.0 | 1.7 | -0.3 | 1.1 | 3.1 | -5.2 | -5.9 | 1.3 | 1.4 | 2.4 | 2.6 |
| Operating profit (£m) | 29.0 | 57.3 | -10.2 | 45.3 | 129 | -205 | -201 | 43.7 | 45.1 | 81.5 | 103 |
| Net profit (£m) | 10.0 | 4.4 | -17.6 | 10.7 | 87.3 | -210 | -273 | -0.3 | 12.7 | 41.1 | 42.7 |
| Reported EPS (p) | 15.8 | 39.3 | -25.3 | 12.8 | 75.5 | -126 | -90.9 | 11.6 | 2.8 | 9.3 | 11.3 |
| Normalised EPS (p) | 56.1 | 58.0 | 72.9 | 65.3 | 81.7 | 98.7 | 80.8 | 51.7 | 17.8 | 18.3 | 11.8 |
| Earnings per share growth (%) | -10.5 | 3.4 | 25.7 | 4.7 | 25.1 | 20.9 | -18.2 | -35.9 | -65.6 | 3.1 | -35.6 |
| Operating cashflow/share (p) | -8.5 | 168 | 172 | 130 | 111 | -53.5 | -37.9 | 22.8 | 16.3 | 41.6 | 50.9 |
| Capex/share (p) | 78.0 | 58.7 | 53.9 | 52.1 | 54.1 | 20.3 | 4.1 | 3.0 | 1.5 | 1.5 | 3.7 |
| Free cashflow/share (p) | -86.5 | 109 | 118 | 77.6 | 57.3 | -73.8 | -42.0 | 19.8 | 14.8 | 40.1 | 47.2 |
| Dividend per share (p) | 56.5 | 54.2 | 63.4 | 56.7 | 58.0 | 4.2 | 0.0 | 0.0 | 0.0 | 0.0 | 5.2 |
| Covered by earnings (x) | 0.3 | 0.7 | -0.4 | 0.2 | 1.3 | -30.0 | 0.0 | 0.0 | 0.0 | 0.0 | 2.2 |
| Net debt (£m) | 210 | 181 | 143 | 146 | 213 | 195 | 510 | 171 | 163 | 124 | 5.1 |
| Net assets/share (p) | 545 | 603 | 587 | 439 | 517 | 274 | 127 | 97.8 | 124 | 115 | 115 |
Source: historic company REFS and company accounts.
Avoiding the “forward work” fudge, Kier’s order book is up only 2%, albeit at a record £11 billion, relative to consensus for £4.2 billion revenue this financial year. Possibly that is to blame for the share price drop, despite the second half “starting well” and a £20 million share buyback launched from 21 January.
The market’s cautious rating is despite 91% of contracts deriving from the UK public sector and regulated companies such as water. Perhaps some projects within over 400 overall are feared sensitive to the chancellor now seeking departmental spending cuts. An average order size around £21 million in construction, mitigates risk if even a few projects do not go to plan.
- What to expect from the 2025 Spring Statement
- Stockwatch: should I buy this cyclical after panic selling?
The end-2024 balance sheet is not strong like Costain’s - £498 million net assets offset by £621 million intangibles, and despite £1,138 million cash there were £1,020 million borrowings and £155 million lease liabilities. Fairly constant trade payables of £968 million relative to £234 million trade receivables bumped up current liabilities to £2,077 million versus current assets of £1,768 million. This helps justify a lower share rating than Costain’s.
In terms of overall risk/reward, Costain therefore looks a preferred choice to buy and hold, although at 121p Kier likely warrants a “buy” rating also, but due to higher financial risk, would need selling if the UK macro story goes from stagflation to recession.
Alert investors may therefore want to consider both, just do not tuck these contractors away complacently.
Edmond Jackson is a freelance contributor and not a direct employee of interactive investor.
These articles are provided for information purposes only. Occasionally, an opinion about whether to buy or sell a specific investment may be provided by third parties. The content is not intended to be a personal recommendation to buy or sell any financial instrument or product, or to adopt any investment strategy as it is not provided based on an assessment of your investing knowledge and experience, your financial situation or your investment objectives. The value of your investments, and the income derived from them, may go down as well as up. You may not get back all the money that you invest. The investments referred to in this article may not be suitable for all investors, and if in doubt, an investor should seek advice from a qualified investment adviser.
Full performance can be found on the company or index summary page on the interactive investor website. Simply click on the company's or index name highlighted in the article.
Disclosure
We use a combination of fundamental and technical analysis in forming our view as to the valuation and prospects of an investment. Where relevant we have set out those particular matters we think are important in the above article, but further detail can be found here.
Please note that our article on this investment should not be considered to be a regular publication.
Details of all recommendations issued by ii during the previous 12-month period can be found here.
ii adheres to a strict code of conduct. Contributors may hold shares or have other interests in companies included in these portfolios, which could create a conflict of interests. Contributors intending to write about any financial instruments in which they have an interest are required to disclose such interest to ii and in the article itself. ii will at all times consider whether such interest impairs the objectivity of the recommendation.
In addition, individuals involved in the production of investment articles are subject to a personal account dealing restriction, which prevents them from placing a transaction in the specified instrument(s) for a period before and for five working days after such publication. This is to avoid personal interests conflicting with the interests of the recipients of those investment articles.