Stockwatch: A spectacular growth stock in the dock
21st September 2018 10:14
by Edmond Jackson from interactive investor
This successful tip returned almost 700%, but has come off the boil in recent months. Companies analyst Edmond Jackson tells us whether it's time to exit or buy the dip.

Smart meters linked to energy utilities are a wave of the future but have splashed into controversy. In February 2017, I asked about Smart Metering Systems: "Is this an enduring growth stock or rollercoaster?"
Then, it was a £500 million AIM-listed business installing and operating the meters on behalf of energy companies, with an operating margin over 36% and the consensus of brokers anticipating £25 million pre-tax profit. The stock was priced at 560p and I'd originally drawn attention at 111p in April 2012, then at 324p in February 2015, as an easy-to-grasp growth story with high recurring income.
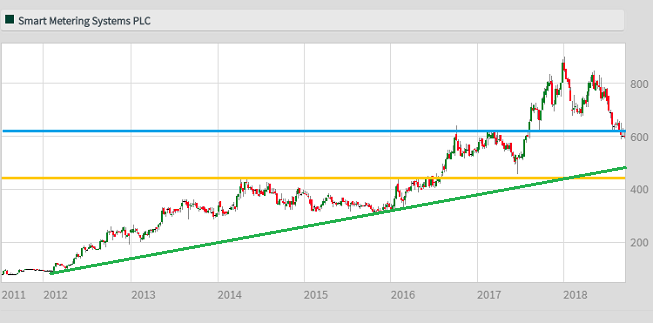
Subsequently, the price dipped to 480p then soared to 875p by end-2017, only to turn volatile again, slumping in the second half of 2018. Latest interims to end-June have done little to boost sentiment, though the stock appears to have found support currently around 600p.
It would appear, both SMS's rating and smart meters are in question, investors wondering if they really do benefit consumers. Currently I wouldn't have one installed as I suspect it might not work if I changed supplier, although a second generation of meters is said to address this. So, quite the way internet TV is replacing analogue, smart meters will be commonplace just not on the schedule hoped.

Source: interactive investor (*) Past performance is not a guide to future performance
Public bodies question smart meter benefits
Installation was initiated by the Labour government in 2008, aiming to help consumers reduce energy use and suppliers manage demand more efficiently. Late last July, however, a parliamentary group challenged the £11 billion scheme to put 53 million smart meters into 30 million homes and small businesses by 2020.
"Predictions of savings are inflated, out of date and based on questionable assumptions" the MPs and peers said. "Smart meter rollout risks going over-budget, past its deadline and must be reviewed immediately." Over half the devices – about 500,000 a year – were said to turn dumb after installation because of problems caused by switching provider and/or poor mobile data coverage.
The National Audit Office is investigating the project for a third time, and the Department for Business, Energy and Industrial Strategy has cut its annual savings estimate on a duel gas/electric bill from £26 to £11 by 2020.
Meanwhile, installation spending is £1 billion more than planned and may exceed the £16.7 billion gross benefit the project was meant to deliver. Just over 11 million smart meters were reportedly operational last March, requiring nearly 1.3 million a month to be installed to meet the 2020 deadline of 40 million.
Such a news context has not surprisingly hit the stock, but the MP's outburst could just prove noise, smart meter rollout seems unlikely to be ditched.
Growth multiple eases from a PE of 40 to 30
The price/earnings (PE) ratio was over 40 times at the stock's highs around 870p last autumn/spring and is presently about 30 times – assuming 12-month forward earnings per share (EPS) of about 20p, the median of 2018/19 forecasts.
Latest interims are strong on revenue and operating profit, each up around 28%. However, pre-tax is up a more modest 9% to £10.1 million on a statutory basis and by only 5% on the company's view of underlying profit; moreover, underlying EPS is down 15% to 8.4p.
• Stockwatch: A rare growth play
When updating the table below it appeared that since February 2017, SMS did not meet 2016 financial year estimates of £20.6 million pre-tax profit and £24.6 million for 2017 or for estimates of EPS. Underlying interim EPS of 8.4p compares with 17.6p expected for 2018, according to two estimates as of end-July. So, without getting neurotic about a miss, it could happen again.
The interims' narrative doesn't give any reassurance about the full-year beyond: "we remain confident in our ability to continue to grow the business for the remainder of 2018 and beyond." There's a caveat about "the transition to SMETS2 (second generation smart meters) bringing some challenges through the second half of 2018".
| Smart Metering Systems - financial summary | Consensus estimates | ||||||
|---|---|---|---|---|---|---|---|
| year ended 31 Dec | 2013 | 2014 | 2015 | 2016 | 2017 | 2018 | 2019 |
| Turnover (£ million) | 27.9 | 42.4 | 53.9 | 67.2 | 79.6 | ||
| IFRS3 pre-tax profit (£m) | 7.5 | 11.0 | 17.5 | 18.2 | 18.0 | ||
| Normalised pre-tax profit (£m) | 7.5 | 11.7 | 17.5 | 18.7 | 18.4 | 23.6 | 32.9 |
| Operating margin (%) | 29.3 | 31.5 | 36.3 | 31.3 | 28.3 | ||
| IFRS3 earnings/share (p) | 7.4 | 10.1 | 16.8 | 17.0 | 17.0 | ||
| Normalised earnings/share (p) | 7.4 | 10.8 | 16.8 | 17.5 | 16.4 | 17.6 | 22.1 |
| Earnings per share growth (%) | 26.4 | 45.1 | 55.7 | 4.5 | -6.7 | 7.6 | 25.5 |
| Price/earnings multiple (x) | 36.9 | 34.4 | 27.4 | ||||
| Annual average historic P/E (x) | 48.8 | 48.4 | 32.0 | 26.0 | 35.0 | 44.3 | |
| Cash flow/share (p) | 7.5 | 27.6 | 26.0 | 32.6 | 43.6 | ||
| Capex/share (p) | 29.2 | 42.7 | 48.6 | 47.2 | 140 | ||
| Dividends per share (p) | 1.9 | 2.6 | 3.0 | 3.6 | 4.5 | 5.8 | 7.0 |
| Yield (%) | 0.7 | 1.0 | 1.2 | ||||
| Covered by earnings (x) | 4.3 | 4.4 | 5.9 | 5.0 | 4.7 | 3.1 | 3.1 |
| Net tangible assets per share (p) | 24.5 | 27.4 | 43.4 | 58.1 | 190 | ||
Source: Company REFS Past performance is not a guide to future performance
Debt is a significant variable in financial reporting
The interim income statement shows a 22.5% advance in operating profit to £12.5 million, despite "other operating income" halving to £1.1 million, then pre-tax profit is checked by net finance costs up 21.3% to £2.3 million. Thus, debt costs are a significant variable, where SMS's financial statements are quite complex also regarding cash.
The interim balance sheet shows an 18% rise in long-term debt to £133 million with near-term debt stable around £17 million, in context of £232 million net assets of which just £15.1 million constitute intangibles. (At 605p, the stock trades at nearly three times net assets.) Balance sheet cash has jumped from £150.6k to £46.8 million, the cash flow statement showing £70.4 million new debt albeit £107 million debt repaid.
It helps to be aware that last November £146 million net was raised via a placing at 690p a share to fund some four million new meters, with management cautioning anything more "would require a further and more extensive funding review". Thus, debt and its costs are a mercurial factor.
The cash flow statement shows SMS continuing to generate meaningful net cash from operations - around £22 million - although the business is clearly capital-intensive to achieve its roll-out. Meanwhile, the operating margin continues to slip from 36.3% in 2015 (see trend in the table), to 30.1% in H1 2017 and was 26.3% in H1 2018.
Management counters smart meter sceptics
A slight slowdown in installation from Q4 2017 is attributed significantly to poor weather also upgrading to second generation meters which ought to resolve problems when people change supplier.
"Smart meters can in fact be shown to increase the customer switching rate. According to OFGEM figures, 23% of customers with a smart meter switched supplier in 2017 compared to 17% of those with a traditional meter."
SMS maintains, smart meters offer consumers "the best opportunity to reduce energy consumption and save money, proving ability to see energy usage/costs in real time and two-way communication with the grid." Quite what these "behavioural changes to reduce energy usage" amount to though? If it's cold then you still need heating on during evenings and possibly before waking up.
For utilities, smart meters "facilitate automated responses to changing demand, better matching of energy supply to consumption...enabling consumers to control when they use, store or export their energy." That assumes consumers have wherewithal. "Energy companies are also tailoring tariffs to use more energy during off-peak periods, and less when demand is high." Again, you'd need capacity to store energy, so what extent of population is involved?
Claims made are thus facing a reality check, it may take a while to resolve.
1.4% of the share capital has been sold short
Two hedge funds account for 0.8% and 0.6% short positions, these each edging up 0.1% in late August. A bearish view could be validated even if SMS affirms double-digit growth – the sense of a "growth company" – just not at the rates implied currently by 30 times projected earnings.
Conceivably also, known doubts are priced in, although I think it will do well to consolidate around 600p until the cloud over smart meters can be dispelled. It could still drift in months ahead if buyers are sidelined by fear of a profit warning.
Holders can take heart, smart meters will still likely become commonplace and SMS a key operator to benefit from earnings quality, even become a bid target. So, it's possible the de-rating is over but you need to decide your appetite for the risks remaining. On a fresh money basis, for now: Avoid.
*The horizontal lines on the chart represent previous levels of technical support and resistance. The green line represents the uptrend since 2012.
Edmond Jackson is a freelance contributor and not a direct employee of interactive investor.
These articles are provided for information purposes only. Occasionally, an opinion about whether to buy or sell a specific investment may be provided by third parties. The content is not intended to be a personal recommendation to buy or sell any financial instrument or product, or to adopt any investment strategy as it is not provided based on an assessment of your investing knowledge and experience, your financial situation or your investment objectives. The value of your investments, and the income derived from them, may go down as well as up. You may not get back all the money that you invest. The investments referred to in this article may not be suitable for all investors, and if in doubt, an investor should seek advice from a qualified investment adviser.
Full performance can be found on the company or index summary page on the interactive investor website. Simply click on the company's or index name highlighted in the article.