Stockwatch: have housebuilding shares put in a low?
A resurgence in popularity has seen stocks in the UK housebuilding sector rally as much as 15% this week. Analyst Edmond Jackson gives his view on prospects and likelihood of a sustainable recovery.
17th January 2025 11:44
by Edmond Jackson from interactive investor

It is a “top-down” question similar to the one I posed about energy producers in my previous article. High-profile cyclical shares were beaten down in the latter part of last year, yet 2025 already shows rebounds of around 10%.
Oil & gas prices have benefited from US oil sanctions on Russia and a cold snap across America and Europe. UK housebuilding shares jumped on 15 January when better-than-expected inflation numbers rekindled hopes of an interest rate cut within weeks, and potentially more through 2025.
- Invest with ii: Top UK Shares | Share Tips & Ideas | Open a Trading Account
Inflation and interest rates resume as dominating factor
A slip in retail price inflation from 2.6% in November to 2.5% last month is immaterial and makes a mockery, for example, of homeware retailer Dunelm Group (LSE:DNLM) proclaiming “solid sales growth of 2.4%” in its half-year to 28 December.
Services inflation – of greater concern to the Bank of England – saw a more definitive fall, however, from 5% to 4.4% - and core inflation slipped from 3.5% to 3.2%, which together suggests a downward path. An argument exists how the central bank should see through lingering inflation – so long as it is falling – rather than wait for its 2% target to manifest, and assume this will in due course.
Equity bulls latched on to remarks by a new member of the Bank’s monetary committee, suggesting rates be cut by 0.25%, four to six times this year, to 3.75% or even 3.25% by December.
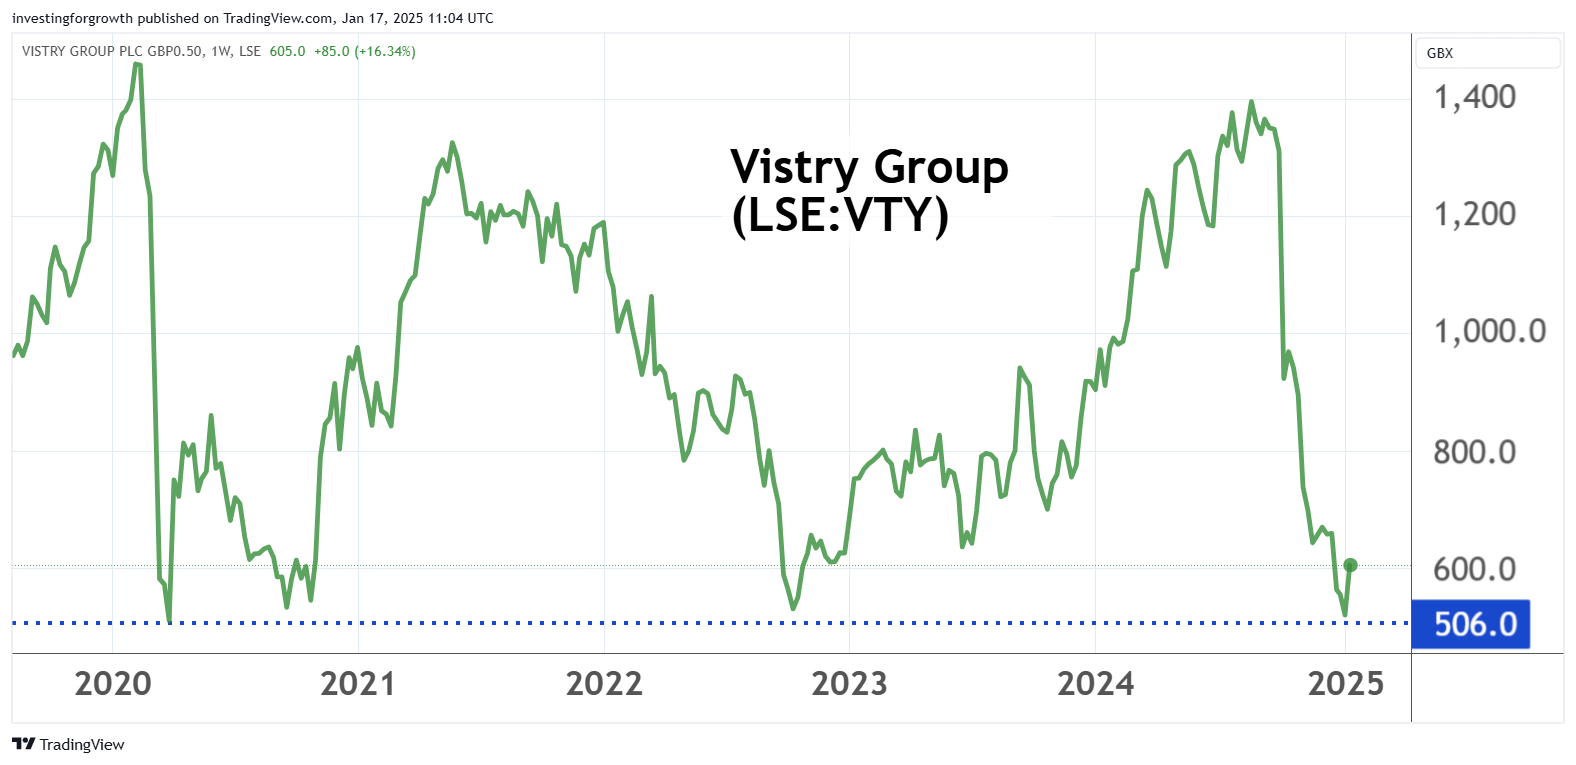
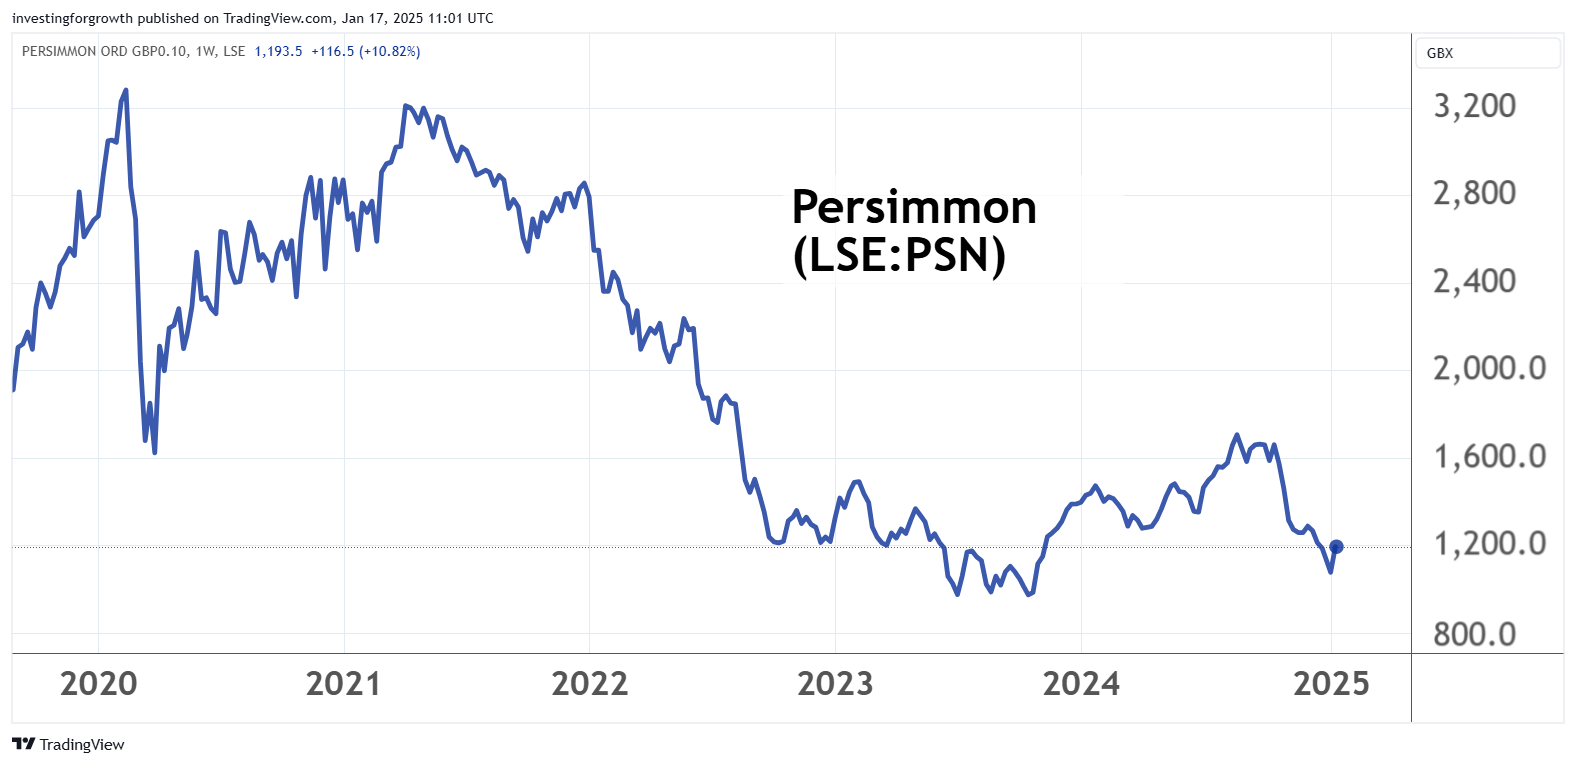
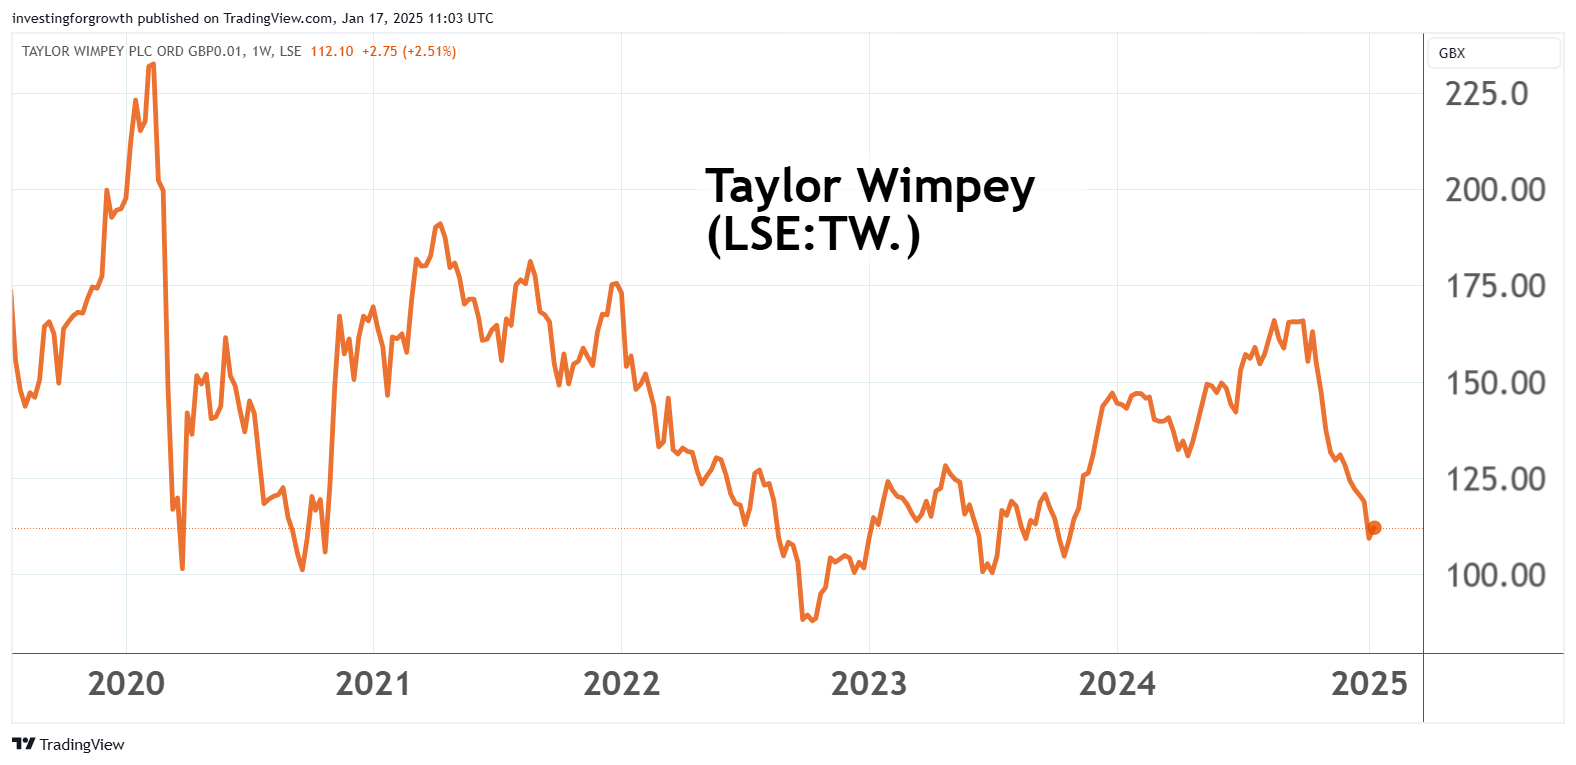
Until this week a UK “stagflation” story was prevailing as employers spoke of raising prices to pass on higher costs of the Budget, and business/consumer confidence alike appeared to fall. Yesterday’s trading update from Taylor Wimpey (LSE:TW.) showed this has not gone away. Despite an overall “in line” reassuring narrative, a caution featured at the end about rising build costs, partly linked to October’s UK Budget, hence the shares closed down 3% at 111p. Initially, this affected Persimmon (LSE:PSN) and Vistry Group (LSE:VTY), yet both absorbed it to edge 1% and 3% higher at 1,180p and 612p respectively.
- Reaction to latest updates from Whitbread and Taylor Wimpey
- ii view: housebuilder Persimmon builds profit hopes
- ii view: housebuilder Vistry details a third profit warning
Today, Persimmon has rallied a further 2% to around 1,200p, likewise Taylor Wimpey to 113p, as if recovery sentiment is intact.
Regarding inflation, the big question is what extent of tariffs Trump’s team introduces in the US, with Canada, for example, already vowing a robust response. It will set the international context for inflation and interest rates, which also affects Britain. Some say Trump is more bark than bite, and resets his demands in negotiations, but I am steeled for a significant attempt to raise US tariffs.
Net asset values show reliability as a prop
Amid this macro tussle it is interesting how a bounce in UK housebuilders has occurred coincidentally after they have fallen to underlying net tangible asset values.
Charts show the fourth quarter of 2024 as particularly harsh on housebuilders where otherwise the trend had been recovery from 2022-23 lows. Recoveries are happening in a context where Taylor Wimpey presently trades on around 0.9x tangible book, Persimmon 1.1x and Vistry 0.9x.


Source: TradingView. Past performance is not a guide to future performance.
Mind that if the macro context turns dire, then discounts to net tangible asset value can become the norm, although this is recalling the aftermath of the 2008 financial crisis.
Overall, the price action looks to be showing that once housebuilders have reverted to this yardstick amid poor sentiment, their stories only need to stop getting worse (for now) to generate rebounds. Persimmon is up 14% from a 1,056p low barely a week ago, and Vistry is up 20% from 512p after its 15 January update provided relief, with nothing actually getting worse following the proverbial three profit warnings culminating on 24 December.
Vistry, however, has specific issues partly deriving from a recent loss of control and uncertainty whether its “partnerships” strategy with councils and housing associations means margins are durable in a tougher environment.
Yield possibly less significant
I would be less swayed by forecast dividend yields as constituting support for the sector. For example, the consensus on Vistry expects 28p a share in respect of 2024 and 36p for 2025, implying a yield above 6% with apparently twice earnings cover.
This is also amid a £130 million share buyback programme from last September to this May, and while its end-2024 net debt was around £180 million, average month-end net debt last year was around £535 million due to delayed completions and lower sales, albeit work-in-progress continuing.
Vistry does target higher cash generation in 2025, and its historic table shows scant capital expenditure. However, a 36p dividend would cost £119 million and, while 2024’s interim statement showed £209 million operational cash flow gross, at the net level £72 million was absorbed after working capital movements and exceptional items – if much improved on £320 million absorbed in the first half of 2023.
Vistry Group - financial summary
year-end 31 Dec
| 2016 | 2017 | 2018 | 2019 | 2020 | 2021 | 2022 | 2023 | |
| Turnover (£ million) | 1,055 | 1,028 | 1,061 | 1,131 | 1,812 | 2,407 | 2,729 | 3,564 |
| Operating margin (%) | 15.2 | 11.8 | 16.4 | 15.8 | 5.1 | 11.9 | 7.8 | 8.2 |
| Operating profit (£m) | 160 | 121 | 174 | 179 | 91.7 | 285 | 212 | 292 |
| Net profit (£m) | 121 | 91.3 | 137 | 138 | 76.8 | 254 | 204 | 223 |
| EPS - reported (p) | 84.2 | 63.5 | 95.0 | 97.7 | 34.7 | 114 | 86.3 | 64 |
| EPS - normalised (p) | 84.2 | 67.3 | 94.7 | 107 | 43.1 | 118 | 143 | 78 |
| Operating cashflow/share (p) | 43.1 | 109 | 90.9 | 153 | 82.2 | 119 | 29.9 | -20.6 |
| Capital expenditure/share (p) | 1.2 | 1.0 | 1.3 | 0.4 | 1.2 | 0.7 | 0.7 | 0.8 |
| Free cashflow/share (p) | 41.9 | 108 | 89.6 | 153 | 81.0 | 118 | 23.2 | 21.4 |
| Dividends per share (p) | 42.1 | 44.4 | 53.3 | 19.2 | 20.0 | 60.0 | 55.0 | 0.0 |
| Covered by earnings (x) | 2.0 | 1.4 | 1.8 | 5.1 | 1.7 | 1.9 | 1.6 | 0.0 |
| Return on total capital (%) | 13.5 | 10.3 | 13.6 | 12.7 | 3.4 | 10.0 | 4.8 | 6.5 |
| Cash (£m) | 38.6 | 170 | 163 | 362 | 341 | 399 | 677 | 418 |
| Net debt (£m) | -38.6 | -145 | -127 | -339 | 4.3 | -201 | -31.6 | 187 |
| Net assets (£m) | 1,016 | 1,057 | 1,061 | 1,272 | 2,195 | 2,391 | 3,250 | 3,319 |
| Net assets per share (p) | 727 | 756 | 760 | 828 | 988 | 1,075 | 940 | 960 |
Source: historic company REFS and company accounts
On the financing side of its interim cash flow statement, Vistry advanced £113 million to joint ventures with the help of £140 million extra debt, hence its buybacks can be seen as partly debt-funded. It therefore begs a question whether the extent of dividend payment is wise versus prioritising debt reduction.
Analysts at UBS investment bank are concerned that factoring in provisions and joint venture obligations, Vistry’s total adjusted debt could reach £1.8 billion – constituting leverage of 5.3x EBITDA (earnings before interest, tax, depreciation and amortisation, a standard debt service measure).
Vistry has specific issues but a consistent factor in this sector is companies often being operationally geared, and the macro context is largely a guess, hence the market often prices stock for meaningful yield to cover the risk of holding them.
Persimmon used to pay out big dividends until 2021, then 2023 was a poor year for cash flow. At least this company has no debt, although the £200 million cost of its circa 62p a share dividend expected for 2024 compares with £350 million balance sheet cash as of last June, the latest update citing year-end net cash of £260 million. So, either the full-year cash flow statement needs to show signs of improvement or management guide firmly better for 2025, to assume consensus for dividend growth above 65p a share for 2025.
Persimmon - financial summary
year-end 31 Dec
| 2016 | 2017 | 2018 | 2019 | 2020 | 2021 | 2022 | 2023 | |
| Turnover (£ million) | 3,137 | 3,598 | 3,738 | 3,649 | 3,328 | 3,611 | 3,816 | 2,773 |
| Operating margin (%) | 24.6 | 26.5 | 29.0 | 28.2 | 23.5 | 26.6 | 19.0 | 12.5 |
| Operating profit (£m) | 771 | 955 | 1,083 | 1,029 | 784 | 961 | 725 | 347 |
| Net profit (£m) | 625 | 787 | 886 | 849 | 638 | 787 | 561 | 255 |
| EPS - reported (p) | 197 | 243 | 281 | 266 | 200 | 246 | 174 | 80 |
| EPS - normalised (p) | 198 | 244 | 283 | 267 | 220 | 247 | 174 | 80 |
| Operating cashflow/share (p) | 220 | 255 | 207 | 194 | 239 | 245 | 125 | -40.4 |
| Capital expenditure/share (p) | 4.6 | 5.6 | 4.9 | 8.6 | 5.9 | 6.5 | 9.5 | 11.3 |
| Free cashflow/share (p) | 215 | 249 | 202 | 186 | 233 | 239 | 116 | -51.7 |
| Dividends per share (p) | 135 | 235 | 235 | 40.0 | 195 | 235 | 60.0 | 60.0 |
| Covered by earnings (x) | 1.5 | 1.0 | 1.2 | 6.7 | 1.0 | 1.1 | 2.9 | 1.3 |
| Return on total capital (%) | 24.6 | 26.8 | 30.7 | 29.5 | 20.9 | 24.6 | 18.4 | 9.0 |
| Cash (£m) | 913 | 1,303 | 1,048 | 844 | 1,234 | 1,247 | 862 | 420 |
| Net debt (£m) | -913 | -1,303 | -1,048 | -844 | -1,234 | -1,247 | -862 | -420 |
| Net assets (£m) | 2,737 | 3,202 | 3,195 | 3,258 | 3,518 | 3,625 | 3,439 | 3,419 |
| Net assets per share (p) | 887 | 1,037 | 1,006 | 1,022 | 1,103 | 1,136 | 1,077 | 1,070 |
Source: historic company REFS and company accounts
A positive tilt in the macro context?
The government’s resolve to relax planning is a key reason why the fourth-quarter 2024 sell-off in housebuilders could have established lows. Much still depends on whether there is sufficient resource, especially labour, to get anywhere approaching government targets for homes.
- The Income Investor: time to exploit economic uncertainty
- Stockwatch: a rare re-rating prospect for 2025
The share price plunge also contrasts with December house price growth of 3.3% despite the highest interest rates since 2008. I question if some of this relates to a modest rush to be agreeing sales now, so as to finalise before the stamp duty threshold (for first-time buyers) falls from £425,000 to £300,000 on 1 April. Might we therefore see some tempering of demand until general activity picks up in spring/summer?
In the medium term, however, consumer confidence – relating to employment and mortgage rates – remains key.
One economist – Richard J Murphy, professor of accounting at the University of Sheffield – asserts that UK housing is 44% more expensive overall (buying or renting) than a spread of major developed nations. Given this hits younger and lower-paid people hardest, it compromises the government’s objective for economic growth. I question quite how it can change. A key ingredient is also high UK land prices.
I conclude with a “hold” rating on the sector. It is possible we have seen a low, but if Trump achieves anything like his declared resolve on tariffs it will disrupt expectations for inflation and interest rates.
Edmond Jackson is a freelance contributor and not a direct employee of interactive investor.
These articles are provided for information purposes only. Occasionally, an opinion about whether to buy or sell a specific investment may be provided by third parties. The content is not intended to be a personal recommendation to buy or sell any financial instrument or product, or to adopt any investment strategy as it is not provided based on an assessment of your investing knowledge and experience, your financial situation or your investment objectives. The value of your investments, and the income derived from them, may go down as well as up. You may not get back all the money that you invest. The investments referred to in this article may not be suitable for all investors, and if in doubt, an investor should seek advice from a qualified investment adviser.
Full performance can be found on the company or index summary page on the interactive investor website. Simply click on the company's or index name highlighted in the article.
Disclosure
We use a combination of fundamental and technical analysis in forming our view as to the valuation and prospects of an investment. Where relevant we have set out those particular matters we think are important in the above article, but further detail can be found here.
Please note that our article on this investment should not be considered to be a regular publication.
Details of all recommendations issued by ii during the previous 12-month period can be found here.
ii adheres to a strict code of conduct. Contributors may hold shares or have other interests in companies included in these portfolios, which could create a conflict of interests. Contributors intending to write about any financial instruments in which they have an interest are required to disclose such interest to ii and in the article itself. ii will at all times consider whether such interest impairs the objectivity of the recommendation.
In addition, individuals involved in the production of investment articles are subject to a personal account dealing restriction, which prevents them from placing a transaction in the specified instrument(s) for a period before and for five working days after such publication. This is to avoid personal interests conflicting with the interests of the recipients of those investment articles.