Stockwatch: a FTSE 100 share I’d buy and one I’ve downgraded
After some impressive share price rallies in recent months, analyst Edmond Jackson wonders if dynamics are turning in favour of insurance and asset management giants?
21st March 2025 11:44
by Edmond Jackson from interactive investor

Notably in recent months, the likes of Aviva (LSE:AV.), Legal & General Group (LSE:LGEN), M&G Ordinary Shares (LSE:MNG), Phoenix Group Holdings (LSE:PHNX) and Prudential (LSE:PRU) have re-rated double-digit percentages.
Aside from Prudential, all these have traded on high single-digit yields, and by wider comparison still do. Is a general mean-reversion therefore under way to rate such shares more appropriately for risk?
- Invest with ii: Open a Stocks & Shares ISA | ISA Investment Ideas | Transfer a Stocks & Shares ISA
An essential comparison of M&G and Prudential is useful - M&G the relatively more stable investment in recent years versus Prudential’s decline, but the future is what counts and Prudential’s rallying over 30% from a mid-January low at around 600p relate significantly to growth hopes based on Asia and Africa.
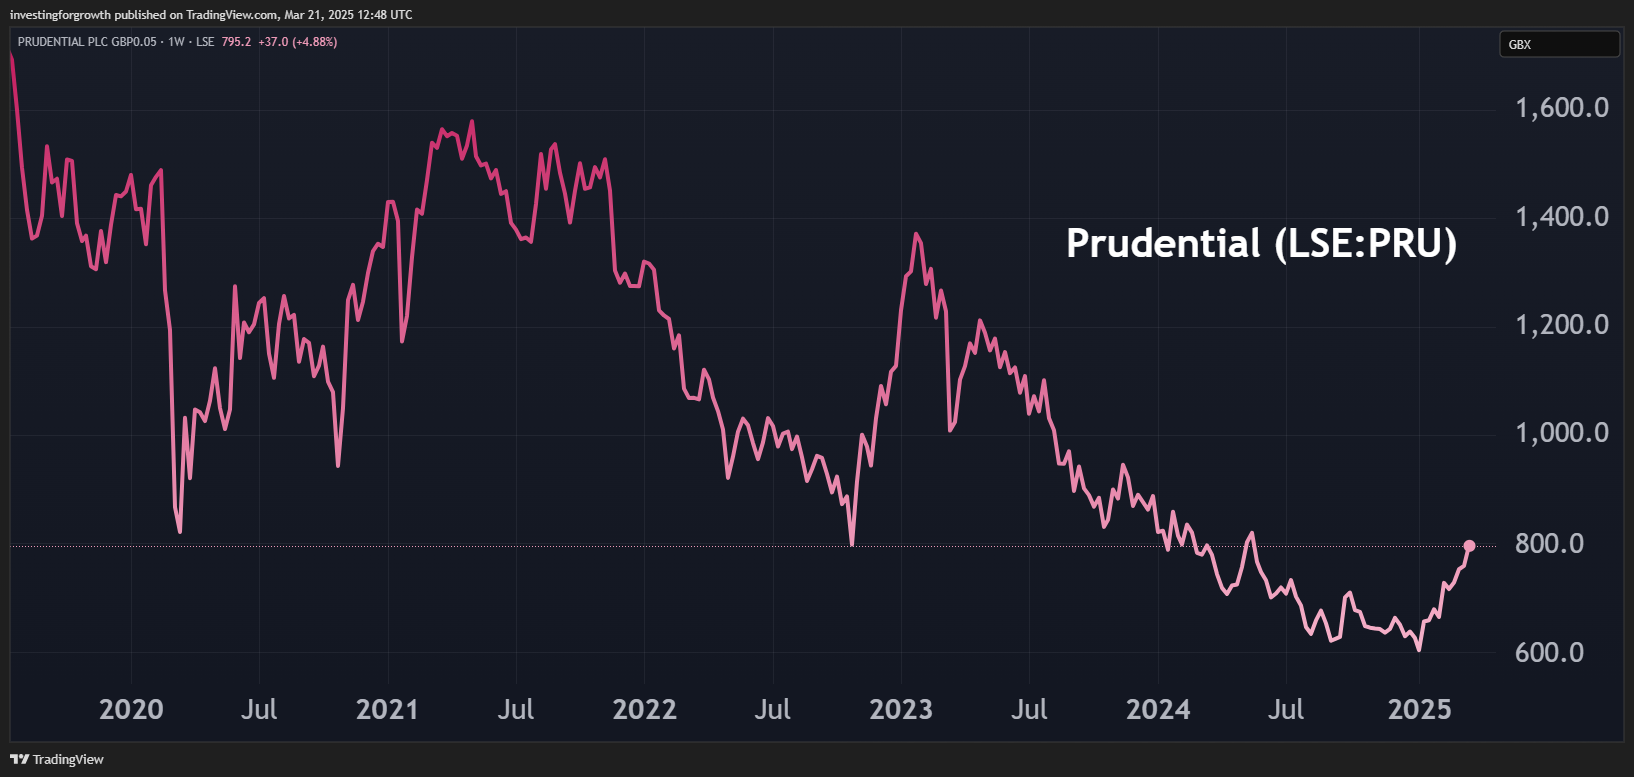
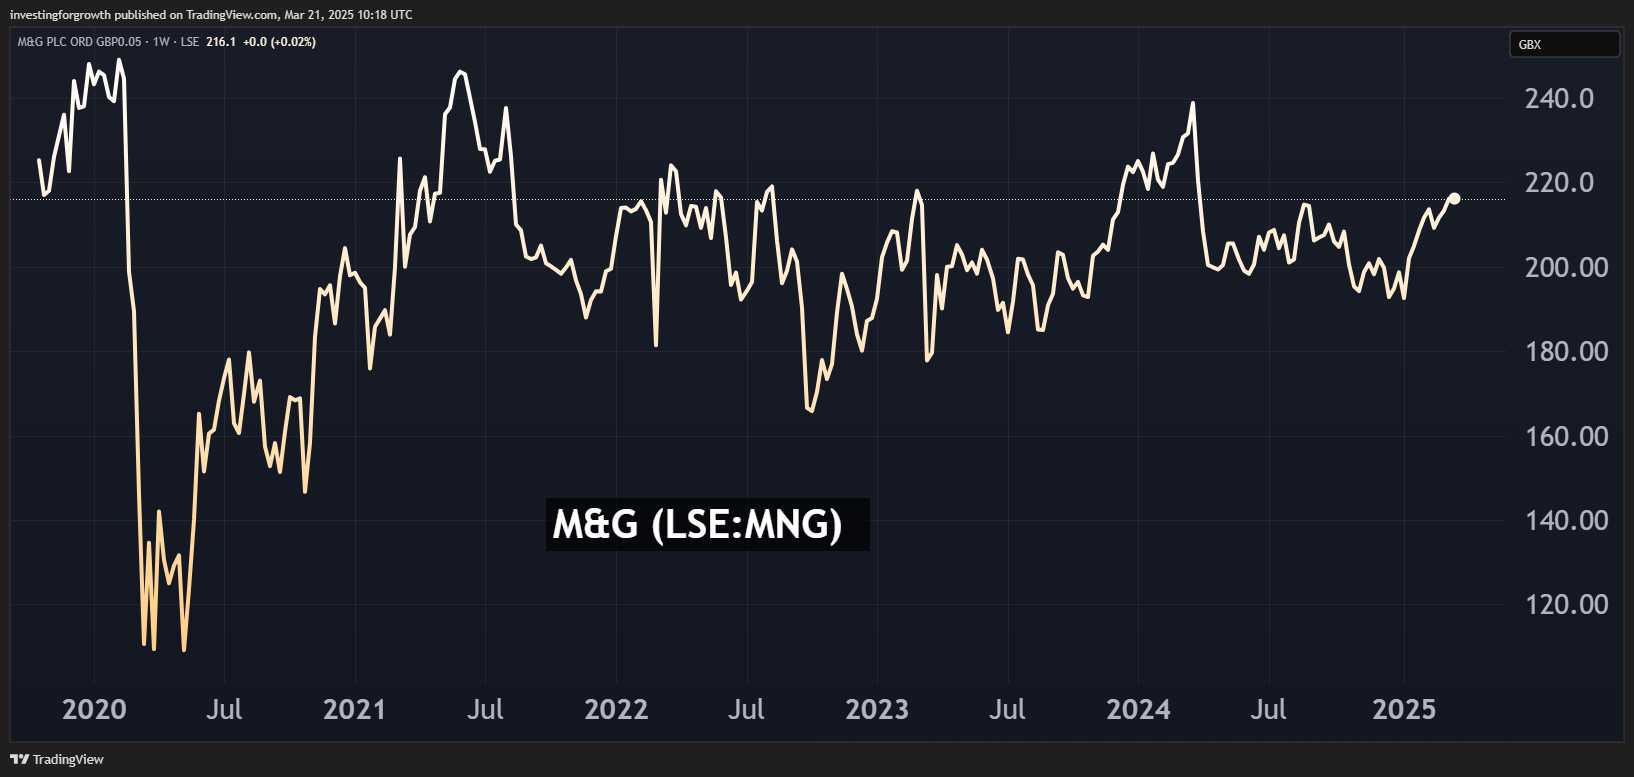
Source: TradingView. Past performance is not a guide to future performance.
There are contrasting yields – M&G offering 9.8% and Prudential 2.4% – although consensus expects M&G to have only around 1.3x earnings cover going forward, versus over 4x for Prudential, which also “returns” more capital currently through buybacks than dividends.
At around 785p presently, Prudential’s forward price/earnings (PE) ratio is around 10x where high single-digit earnings per share (EPS) growth anticipated this year implies a price-to-growth (PEG ratio) of 1.1 – strictly you should seek below 1.0. Consensus does, however, expect 2026 to deliver 15% earnings growth, assuming China (and implicitly Hong Kong where Prudential is successful) does not get hit hard in a trade war.
- ii view: income play M&G exceeds profit forecasts
- Prudential starting to fire on all cylinders
- Legal & General confirms share buybacks and big dividends
- ii view: Phoenix Group beefs up cash and profit forecasts
M&G is also expected to deliver a better 2026 with similar earnings growth to Prudential, although its 2024 results are to me quite disappointing since drawing attention as a “buy” at 207p nearly a year ago. I did however suggest diversifying among other life/health-type insurers offering similar fat yields - 8.5% for Legal & General at 250p (currently 243p) and Aviva 7.2% at 490p (currently 550p).
You do, however, need to delve beyond the headlines of annual results releases, the income statements for these insurance/investment giants being complex and affected by big fair value movements in insurance contracts. The underlying trajectory is less likely summarised by comparing percentages of net profit growth.
M&G shares joined the party from mid-January, rising 18% from 191p to 226p achieved in early trading after the release of its 2024 results.
Somewhat in contrast to Prudential, however, it has slipped to 217p despite the front page of its results statement proclaiming “a new progressive dividend policy”. This seems more slogan than specifics, as a 2% dividend rise to 20.1p per share in respect of 2024 is broadly in line with marginal increases previously.
Consensus does, however, look for 20.6p this year and 21.2p for 2026, hence the shares should be around a support level unless financial chaos from the Trump administration and a gnawing UK fiscal gap conspire to trigger a recession.
M&G - financial summary
Year-end 31 Dec
| 2018 | 2019 | 2020 | 2021 | 2022 | 2023 | 2024 | |
| Turnover (£ million) | -4,627 | 30,682 | 14,036 | 14,739 | 786 | 5,115 | 4,854 |
| Operating margin (%) | -21.3 | 11.9 | 25.0 | 4.5 | -466 | 16.4 | 2.6 |
| Operating profit (£m) | 985 | 3,657 | 3,516 | 656 | -3,665 | 838 | 128 |
| Net profit (£m) | 33.0 | 1,120 | 1,138 | 83.0 | -2,068 | 309 | -347 |
| Reported EPS (p) | 31.1 | 40.8 | 44.0 | 3.2 | -83.6 | 12.4 | -15.1 |
| Normalised EPS (p) | 43.8 | 50.1 | 56.5 | 12.6 | -73.1 | 20.4 | 0.3 |
| Return on total capital (%) | 0.5 | 1.6 | 1.5 | 0.3 | -1.9 | 0.4 | 0.1 |
| Operating cashflow/share (p) | 54.1 | 7.9 | 99.6 | 50.8 | -20.4 | 84.1 | 28.4 |
| Capex/share (p) | 9.3 | 15.1 | 31.7 | 29.9 | 23.2 | 20.7 | 12.1 |
| Free cashflow/share (p) | 44.8 | -7.2 | 67.9 | 20.9 | -43.5 | 63.4 | 16.3 |
| Dividend per share (p) | 0.0 | 11.9 | 18.2 | 18.3 | 19.6 | 19.7 | 20.1 |
| Covered by earnings (x) | 0.0 | 3.4 | 2.4 | 0.2 | -4.3 | 0.6 | 0.0 |
| Cash (£m) | 6,373 | 5,848 | 6,518 | 6,908 | 4,298 | 5,148 | 4,838 |
| Net debt (£m) | -1,976 | 2,007 | 2,096 | 2,435 | 3,614 | 2,886 | 2,072 |
| Net assets/share (p) | 344 | 197 | 215 | 278 | 182 | 171 | 136 |
Source: company accounts.
M&G’s performance is rather a curate’s egg
While M&G’s total assets under management edged up 0.7% to £345.9 billion, acquisitions masked a reversal in net flows from asset management and the like, from £1.7 inflows to £1.9 billion outflows. Helped by aggressive cost-cutting and a strong asset management result, adjusted operating profit rose 5% to £837 million and was at least a 9% beat on recent consensus for a fall to £769 million. Perhaps this helped the initial jump in share price.
Investment performance looks respectable enough in context: 63% of wholesale funds in the upper two performance quartiles over three years, and 59% over five years to end-2024. Over 75% of institutional asset management funds outperformed their benchmarks on a three and five-year basis.
Management says it has continued to simplify its business, for example rationalising its wealth business through a restricted advice channel and making funds more accessible on third-party platforms. This comes after £188 million of savings were achieved in the first two years of the programme, such target raised to £230 million by end-2025.
But a key question for growth in investment value is whether further cost-cutting is necessary if net flows do not improve, which might be very hard. In this sense, the 2024 profit beat is exceptional.
The financial statements are similarly uninspiring
From the income statement downloadable from the company’s website, we find the following.
Yes, investment return has edged up 0.6% to £8,686 million but a 16% hike in net insurance finance expenses to £8,426 million (notes cite “application of IFRS 17”, accounting for insurance contracts) whittles down the net insurance/investment result by 42% to £1,346 million.
Administrative expenses rise 15% to £2,566 million and pre-tax profit of £145 million is rescued by £363 million “movements in third-party interest” in consolidated funds. Even so, a £309 million net profit in 2023 has become a £347 million net loss.
With annual dividends strictly uncovered by earnings, their £468 million cost is accommodated by £4,838 million year-end cash, despite this easing 6% from £5,148 million. There is no debt beyond £425 million leases, but you get the reason why the dividend is up only 2%.
It is a reminder how returns from major asset management/insurance groups are prone both to confidence in financial markets, and inherent complexity.
- The undervalued insurance stocks about to come back into vogue
- India IPO plan is good for Prudential's share price
- Sign up to our free newsletter for investment ideas, latest news and award-winning analysis
Cash generated by operations has also fallen from £1,719 million to £677 million. The statement is rescued by reduced investment on property/plant/equipment. But even though year-end cash fell 6% to £4,838 million, this position was strong enough for M&G to spend £450 million repurchasing subordinate debt besides £468 million on dividends.
Perhaps M&G can continue to piggy-back general re-ratings in big insurance/investment groups – especially if benefiting from global asset re-allocation from US technology shares, say, to UK high-yield.
M&G goes ex-dividend on 27 March, which, if last year offers any precedent, involved a greater than logical market drop. The shares are therefore worth watching to buy on such a technical market issue, as part of a diversified income portfolio. In general, I would prefer to see M&G improve its fund outflows, hence adjust my overall stance from “buy” to “hold”.
Prudential has firmer credentials as all-round recovery share
Pru’s 2024 income statement benefits from a near-50% positive swing in the net finance expense from insurance contracts, but performance-wise, its insurance service result rose 10% and the net investment result by 22%, with reported net profit up 41% to $2,415 million (£1.865 million) and earnings per share by 36%.
While $600 million or so is being paid out in respect of 2024 dividends, $785 million was “returned” so to speak last year as part of a $2 billion share buyback programme which continues. Moreover, net cash from operations soared from $832 million to $3,609 million. Buybacks tempered growth in year-end cash to 21% to $5,772 million.
If compromises can be found on US tariffs – which could take a lot more pain by way of US economic data, to force the current breed of Republicans out their “Make American Great Again” dogma – then Prudential currently looks the best-placed of the London-listed insurance/investment giants.
But if the US administration stays stubborn, mind the risk of how “developing markets”, lately a plus point for Prudential, could turn negatively for the medium term. Repeatedly over decades, “emerging markets” get promoted as resilient to a downturn then get hit in a wider one, hence the adage about how “you cannot escape in an emergency”. This, I believe, is the essential hinge in Prudential’s risk/reward profile, and that financial market volatility remains a key factor.
Overall, and despite my missing the recent rally, at around 785p today I rate Prudential a “buy” for total long-term return.
Edmond Jackson is a freelance contributor and not a direct employee of interactive investor.
These articles are provided for information purposes only. Occasionally, an opinion about whether to buy or sell a specific investment may be provided by third parties. The content is not intended to be a personal recommendation to buy or sell any financial instrument or product, or to adopt any investment strategy as it is not provided based on an assessment of your investing knowledge and experience, your financial situation or your investment objectives. The value of your investments, and the income derived from them, may go down as well as up. You may not get back all the money that you invest. The investments referred to in this article may not be suitable for all investors, and if in doubt, an investor should seek advice from a qualified investment adviser.
Full performance can be found on the company or index summary page on the interactive investor website. Simply click on the company's or index name highlighted in the article.
Disclosure
We use a combination of fundamental and technical analysis in forming our view as to the valuation and prospects of an investment. Where relevant we have set out those particular matters we think are important in the above article, but further detail can be found here.
Please note that our article on this investment should not be considered to be a regular publication.
Details of all recommendations issued by ii during the previous 12-month period can be found here.
ii adheres to a strict code of conduct. Contributors may hold shares or have other interests in companies included in these portfolios, which could create a conflict of interests. Contributors intending to write about any financial instruments in which they have an interest are required to disclose such interest to ii and in the article itself. ii will at all times consider whether such interest impairs the objectivity of the recommendation.
In addition, individuals involved in the production of investment articles are subject to a personal account dealing restriction, which prevents them from placing a transaction in the specified instrument(s) for a period before and for five working days after such publication. This is to avoid personal interests conflicting with the interests of the recipients of those investment articles.