Stockwatch: is another retailer in takeover territory?
With shares trading at Covid crash prices, and the CEO set to leave the firm in April, analyst Edmond Jackson reviews his rating on the stock.
25th February 2025 12:01
by Edmond Jackson from interactive investor

B&M European Value Retail saw a quite remarkable turnaround on Monday. Throughout the morning, the FTSE 250 shares fell 12% to 255p in response to the shock departure of the CEO at the end of April. Profit guidance for the current year to 31 March was guided down – if only by 3% when using median points in the ranges suggested – which did not help in a context that has seen three updates show declines in like-for-like revenues.
- Invest with ii: Top UK Shares | Free Regular Investing | Open an investment Account
The share price then rebounded strongly throughout the afternoon to close 2% down at 285p as investors considered the news. Even if B&M European Value Retail SA (LSE:BME) cancels its special dividends that imply a yield of around 8%, based on the ordinary payouts the yield should now be at least 5%, with ample cover, due to a retailer’s strong cash generative model.
Just possibly, speculators wonder if B&M has already got itself into territory quite like Morrisons was before it was taken over by US private equity in 2021. As I explain below, the balance sheet here has nothing like the strong asset-backing of Morrisons, while in the “value” retail space there is a precedent of Poundland and Wilko going into administration. Takeover prospects are tricky to evaluate.
But while it is initially presented as if the CEO is opting to “retire” (aged 53), a reference to “severance terms” makes it clear that he was pushed. This feels a bit like scapegoating instead of collective responsibility. BME’s board has certainly approved special dividends, which could otherwise have paid down debt and, arguably also, the aggressive store expansion that has lately preserved revenue growth.
- Stockwatch: are bears right to bet against this FTSE 100 firm?
- Watch our video: Nick Train: ‘generational’ opportunity to buy UK growth firms
How then, is this board likely to recruit someone who is going to do something tough and radical? They have all rather lost credibility, and it starts to look as if a Mike Ashley-type is needed.
A tough retailing context is significantly responsible
This is another reason why ditching the CEO is a bit odd and disruptive, unless someone radical and vigorous enough can work with the current board.
It is useful to recall the context of when I last examined B&M in January 2023; how trading conditions and market expectations can be capricious. Retail shares rallied due to better-than-expected performance from Next (LSE:NXT), Greggs (LSE:GRG) and B&M – it was also sporting a classic “inverted head and shoulders” reversal pattern, implying a rally to at least 500p.
Indeed, it was a key turning point for Next after the Covid roller coaster:
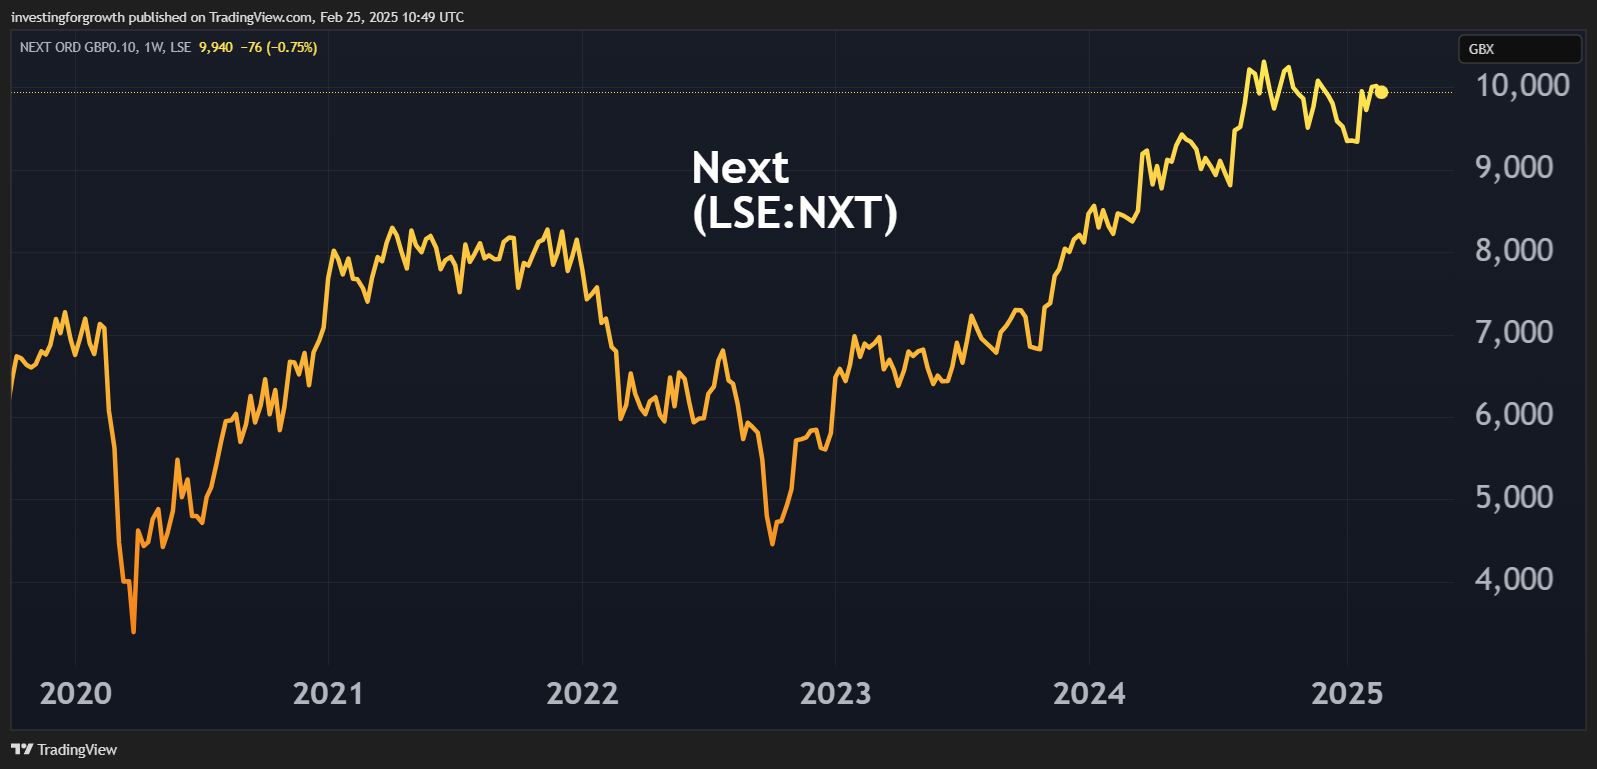
Source: TradingView. Past performance is not a guide to future performance.
But Greggs has some similarities with BME by way of volatile-sideways trend. It initially rallied over 30% from around 2,400p to 3,180p, but is now down to around 2,100p as costs both to consumers and the business bite:
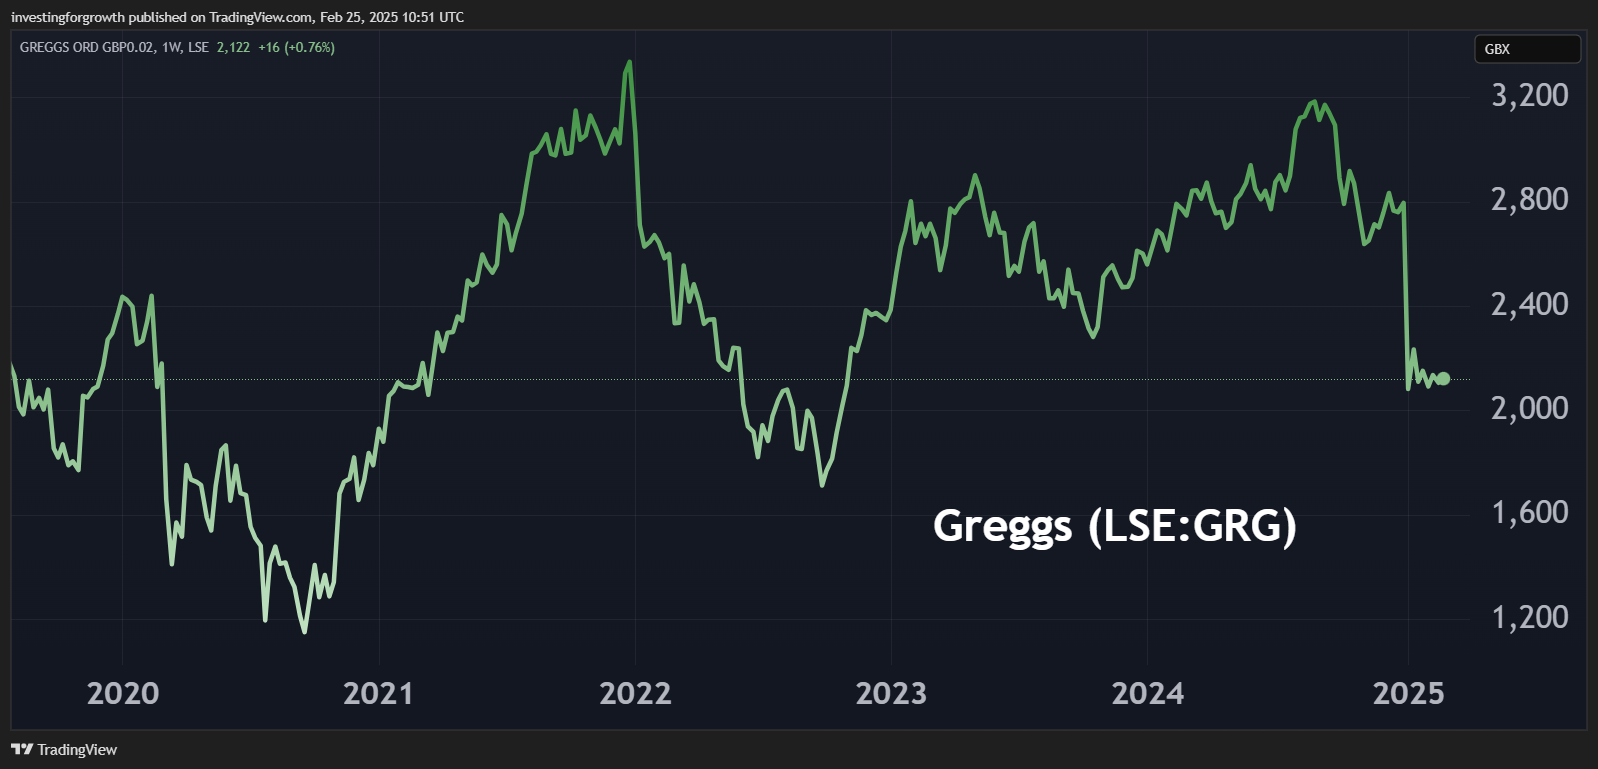
Source: TradingView. Past performance is not a guide to future performance.
Likewise, B&M rallied over 30% from around 440p over 600p by end-2023, but surrendered all that and more – at yesterday’s lows it’s back to where it traded in October 2022 prior to Covid vaccines appearing.
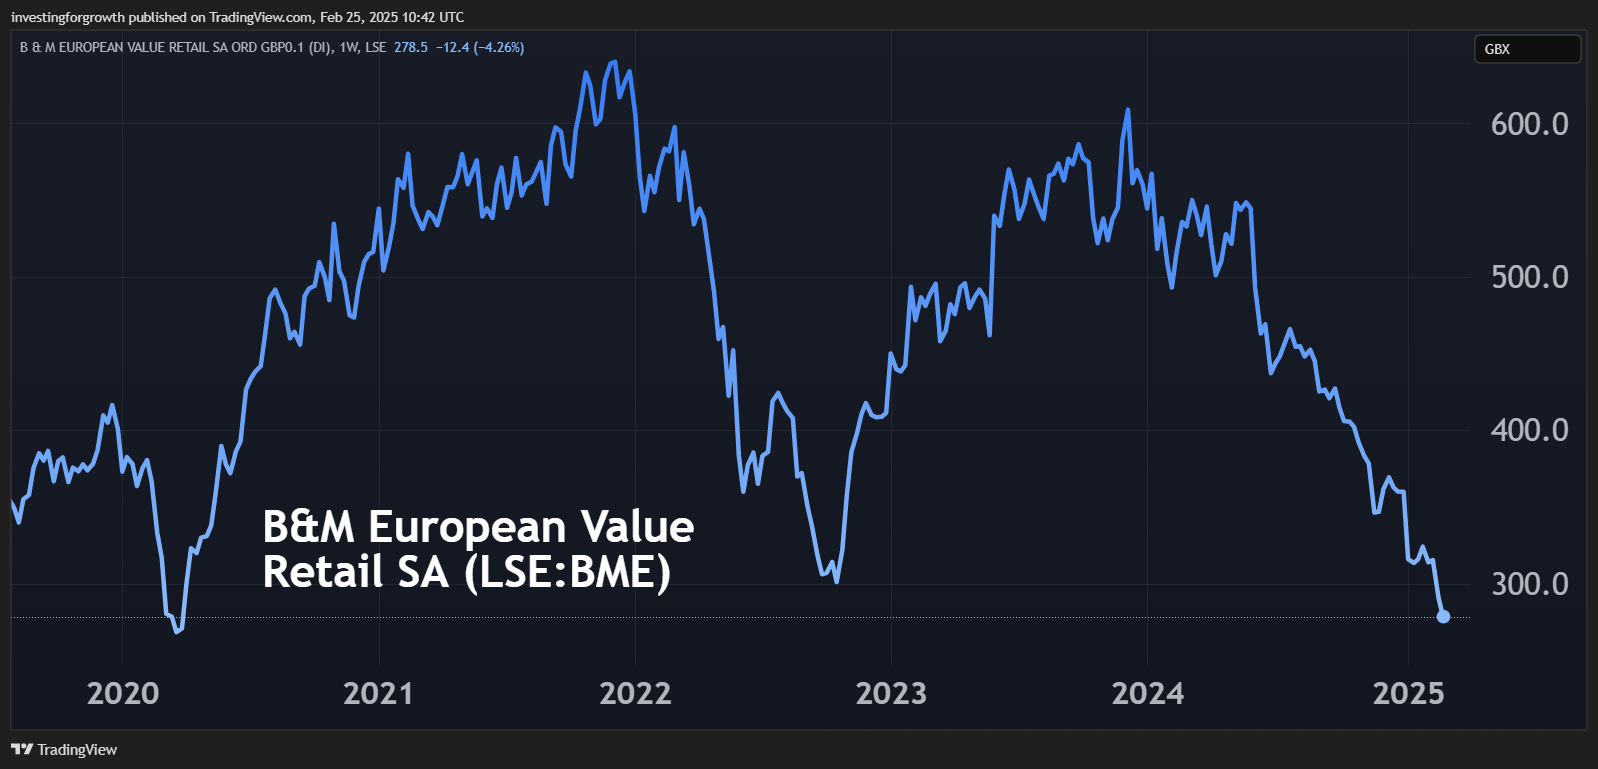
Source: TradingView. Past performance is not a guide to future performance.
I noted to beware propensity for change. B&M had risen from a “buy” case made at 390p in June 2022 to over 450p, its fourth-quarter revenue up 12%, but like-for-like retail footfall fell by a quarter in the last week of that December. I thought holders might stay lucky for the special dividends “yet calling retail shares is capricious when we are yet to see the full effects of cost-of-living increases”. I compromised at “hold”.
By July 2024, B&M had retreated to this January 2023 level, then from August fell relentlessly and despite yesterday’s rebound, the closing price means strictly that the chart has yet to define support.
- Shares for the future: four stocks facing the axe from my top 40
- Sign up to our free newsletter for investment ideas, latest news and award-winning analysis
Interim results to end-September showed total sales growth of 3.7%, which is reasonable enough, with like-for-like data “improving” by way of a 1.9% slip in the second quarter after 5.1% in the first. A 9 January update regarding the third quarter, however, cited a 2.8% slip in like-for-like sales, while the store-opening programme supported overall revenue growth at 3.3%.
The UK accounts for around 92% of group revenue, with the rest in France. Store expansion is material this financial year: 73 new stores are planned - 45 B&M in the UK, 11 in France, and 17 Heron Foods stores. There are 45 new openings planned this coming financial year, with a long-term target of not less than 1,200 UK stores.
But if like-for-like data is showing sales declines effectively over 5% in inflation-adjusted terms, is vigorous expansion justified? True, Aldi and Lidl are UK success stories, rolling out new stores, but they are selling essential food items versus B&M that is mainly merchandise. In all cases, however, and with the UK now apparently intent on cutting immigration versus a declining native demographic, retailers are going to end up fighting each other for share.
In fairness to B&M, its professed “industry-leading return on capital over 30%” is affirmed by historic data showing return on total capital often over 20%, and returns on equity have for three years since Covid been over 50%.
B&M European Value Retail SA
year-end 31 Mar
| 2016 | 2017 | 2018 | 2019 | 2020 | 2021 | 2022 | 2023 | 2024 | |
| Turnover (£ million) | 2,035 | 2,431 | 3,030 | 3,273 | 3,813 | 4,801 | 4,673 | 4,983 | 5,484 |
| Operating margin (%) | 8.6 | 8.4 | 7.9 | 9.7 | 8.7 | 12.8 | 13.1 | 10.8 | 11.1 |
| Operating profit (£m) | 174 | 205 | 240 | 319 | 333 | 613 | 610 | 536 | 608 |
| Net profit (£m) | 125 | 143 | 186 | 194 | 90.0 | 428 | 422 | 348 | 367 |
| EPS - reported (p) | 12.4 | 14.3 | 18.6 | 19.8 | 20.4 | 42.7 | 42.1 | 34.7 | 36.5 |
| EPS - normalised (p) | 13.2 | 14.8 | 19.1 | 19.8 | 17.7 | 43.1 | 42.2 | 34.7 | 37.0 |
| Operating cashflow/share (p) | 14.3 | 17.9 | 19.8 | 37.5 | 54.9 | 82.5 | 49.0 | 77.9 | 74.3 |
| Capital expenditure/share (p) | 5.7 | 5.2 | 11.5 | 10.6 | 12.4 | 8.8 | 10.0 | 9.8 | 12.5 |
| Free cashflow/share (p) | 8.6 | 12.7 | 8.3 | 26.9 | 42.4 | 73.7 | 39.0 | 68.1 | 61.7 |
| Dividends per share (p) | 4.8 | 5.5 | 7.2 | 7.6 | 8.1 | 17.3 | 16.5 | 14.6 | 14.7 |
| Covered by earnings (x) | 2.6 | 2.6 | 2.6 | 2.6 | 2.5 | 2.5 | 2.6 | 2.4 | 2.5 |
| Return on total capital (%) | 12.8 | 13.8 | 14.8 | 12.0 | 12.8 | 23.3 | 21.2 | 19.6 | 21.5 |
| Cash (£m) | 91.1 | 156 | 90.8 | 86.2 | 428 | 218 | 173 | 237 | 182.0 |
| Net debt (£m) | 349 | 396 | 530 | 1,814 | 1,640 | 1,814 | 2,093 | 2,018 | 2,085 |
| Net assets (£m) | 802 | 800 | 912 | 992 | 867 | 733 | 746 | 720 | 734 |
| Net assets per share (p) | 80.2 | 80.0 | 91.1 | 99.2 | 86.7 | 73.2 | 74.5 | 71.9 | 73.2 |
Source: historic company REFS and company accounts.
It’s why I think the CEO’s exit is likely to be no quick fix, as if a strategy re-fix may be required for the environment that’s unfolding – then to find the right person to implement it. Also of concern is the trading director (genuinely) retiring in March, a brother of a former CEO, responsible for stock buying and the various offer strategy that can coax people in-store.
End-September balance sheet hardly supports bid speculation
Retail can be attractive to private equity buyers given that its model tends inherently to be cash generative, hence debt can be employed in the takeover and potentially paid down also by sale and leaseback of assets. Morrisons was also an asset-stripping opportunity due to its extent of vertical integration - owning parts of its supply chain besides substantial property.
Yet B&M’s 30 September balance sheet had negative net tangible assets and is already leased-up. Within £742 million net assets equivalent to 74p a share, there are modest “real” assets.
Property, plant and equipment constitute £439 million; there are £1,103 million “right of use” or leased assets relating to £1,379 million lease liabilities. Total bank debt of £964 million generated £28 million net interest costs in the first-half-year, which combined generated £38 million lease costs and cut interim profit before interest and tax by 28% to £169 million.
Despite £185 million cash, net gearing on £742 million net assets can therefore be seen as 105%. And, if subtracting £1,041 million goodwill and intangibles, you get £299 million negative net assets. Perhaps net debt plus leases of £2,159 million is the more realistic sum of liabilities to be servicing here.
It explains why investors who care to look at balance sheets have increasingly been skeptical of B&M, despite its glowing record on dividends. It’s as if a financial reset is necessary – at least by cancelling special dividends to reduce debt – besides a marketing one.
Can a radical new CEO succeed?
Objectively, the interview has to involve a mega-row – with the board chair at least – about how B&M is vigorously expanding into a weaker retail market and with a stretched balance sheet. So, is the real person required going to get recruited?
You start to realise why a Mike Ashley-type is necessary and thrives in UK retail. B&M has arguably quite lost its way.
The shares thus appear to have further downside risk if B&M’s overall competitive pitch is being crowded out by other operators in a tough environment. A reset of strategy and operations by the right leader could however be well received. So, the shares are a play on this happening, which currently makes them speculative. Checking today’s price, it is down 2% at 279p, hence on a chart view also, buyers would properly seek a sounder floor. Hold.
Edmond Jackson is a freelance contributor and not a direct employee of interactive investor.
These articles are provided for information purposes only. Occasionally, an opinion about whether to buy or sell a specific investment may be provided by third parties. The content is not intended to be a personal recommendation to buy or sell any financial instrument or product, or to adopt any investment strategy as it is not provided based on an assessment of your investing knowledge and experience, your financial situation or your investment objectives. The value of your investments, and the income derived from them, may go down as well as up. You may not get back all the money that you invest. The investments referred to in this article may not be suitable for all investors, and if in doubt, an investor should seek advice from a qualified investment adviser.
Full performance can be found on the company or index summary page on the interactive investor website. Simply click on the company's or index name highlighted in the article.
Disclosure
We use a combination of fundamental and technical analysis in forming our view as to the valuation and prospects of an investment. Where relevant we have set out those particular matters we think are important in the above article, but further detail can be found here.
Please note that our article on this investment should not be considered to be a regular publication.
Details of all recommendations issued by ii during the previous 12-month period can be found here.
ii adheres to a strict code of conduct. Contributors may hold shares or have other interests in companies included in these portfolios, which could create a conflict of interests. Contributors intending to write about any financial instruments in which they have an interest are required to disclose such interest to ii and in the article itself. ii will at all times consider whether such interest impairs the objectivity of the recommendation.
In addition, individuals involved in the production of investment articles are subject to a personal account dealing restriction, which prevents them from placing a transaction in the specified instrument(s) for a period before and for five working days after such publication. This is to avoid personal interests conflicting with the interests of the recipients of those investment articles.