A stock in one chart: Lloyds Banking
7th April 2016 11:27
by Phil Oakley from ii contributor
Professional investors judge how good a bank is by looking at its return on equity (ROE). This is calculated by comparing its post-tax profits with the amount of money invested by shareholders (equity).
Investors can learn more about how a company generates its ROE by breaking its calculation down further. A company's ROE is a function of two things:
• the profit it makes on its assets (mainly loans)
• how leveraged those assets are i.e. how much equity supports them.
ROE equals return on assets mutiplied by leverage ratio - or:

The trouble with banks is that they aren't really that profitable if you look at their return on assets. But just as a buy-to-let landlord can juice up their returns by taking on a big mortgage, banks can do the same thing by taking on more debt.
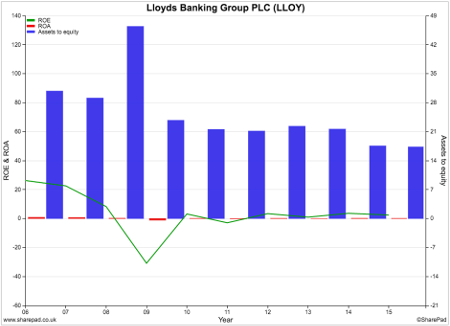
Back in 2007, looked like it was flying high with ROE of 22.6%. The truth was that it could only do that by taking on lots of debt. Its return on assets was a paltry 0.8%, but its ROE was magnified up by the fact that its assets were over 29 times the size of shareholders' equity - its leverage ratio. It was 29 times leveraged (or geared). Bear in mind that a property with a 95% mortgage is equivalent to being 20 times geared.

Banks will always have a certain amount of gearing as they are predominantly financed by customer deposits, which are like debt. The problem with banks back in 2007 was that they took on too much extra debt. They had too much debt and too many assets relative to their equity and were cruelly exposed when the financial crisis hit and lots of loans went bad.
Since then, banks have been deleveraging and their leverage ratios (the blue bar in the chart) have been coming down as they try to become less risky. In 2015, Lloyds' leverage ratio had come down to 17.3. Unfortunately, Lloyds' return on assets had fallen to 0.2% and its ROE to 2.4% (the green line on the chart).
Lloyds will point out that these results contain the effects of a lot of one-off or exceptional bad stuff such as compensation for mis-selling payment protection insurance (PPI). If these are excluded, then the underlying ROE is much higher - around 15%. A return to dividend payments will also be seen as a sign of improving health.
This is true, but can Lloyds - and other banks - earn sustainable returns on shareholders' money to keep investors happy without high levels of leverage? Its lacklustre share price performance during the last year suggests this is far from certain.
Despite a lot of good work to make the bank simpler and less risky, it is still a leveraged bet on the fortunes of the UK economy. A slowing world economy, rising UK household borrowing and any downturn in the UK housing market remain key risks for investors.
The ii view
February's full-year results were nothing spectacular, but an increasingly robust balance sheet pleased investors and keeps Lloyds' dividend recovery on track. A 1.5p ordinary dividend and 0.5p special both went ex the payout on 7 April. Dividend growth is exciting, but the shares have fallen from last month's nine-week high, and a sustainable rally seems likely only once interest rates begin to rise.
Read more from Phil Oakley here. Financial charts are a feature of SharePad, the web-based service from ShareScope. Voted UK's Best Investment Software 2015.
This article is for information and discussion purposes only and does not form a recommendation to invest or otherwise. The value of an investment may fall. The investments referred to in this article may not be suitable for all investors, and if in doubt, an investor should seek advice from a qualified investment adviser.