Share Sleuth: performance over 15 years, and a share sale
After the portfolio recently celebrated its 15th birthday, Richard Beddard gives a more detailed breakdown of performance, and explains why he's waved goodbye to one holding.
6th November 2024 10:42
by Richard Beddard from interactive investor

No surprise, considering the score I gave PZ Cussons last month, that I removed the shares from the Share Sleuth portfolio on 23 October.
The score was 4.4 out of 10, the second-lowest score of the 40 shares in the Decision Engine, and the lowest-scoring Share Sleuth member.
- Invest with ii: Top UK Shares | Share Tips & Ideas | What is a Managed ISA?
Before I made the decision, a reader had emailed me to pass on their rationale for selling. They shared my view that the devaluation of the Nigerian currency has put PZ Cussons (LSE:PZC) heavily in debt, and precipitated a major change in strategy.
They believed there was little chance the share price would recover. And they wondered if that was the subtext of my article.
I was grateful for the opportunity to point out that it was not.
Confidence in the prospects of a company, and consequently its share price, comes when I understand how it makes money, what it needs to make more, and what could stop it. If the strategy is coherent and addresses the risks, I am usually confident.
In principle, PZ Cussons’ strategy is pretty straightforward. It must make major disposals to shore up its finances and focus the business, but I do not know whether it will be enough to address the risks.
- ii view: results cause big slip at soap maker PZ Cussons
- Sign up to our free newsletter for investment ideas, latest news and award-winning analysis
Maybe the share price will recover, maybe it will not. I would rather leave those judgements to speculators and turnaround specialists.
Selling PZ Cussons
On Wednesday 23 October, I liquidated 1,870 shares in PZ Cussons, at a shade over 86p per share.
After deducting £10 in lieu of broker fees, it raised £1,599.
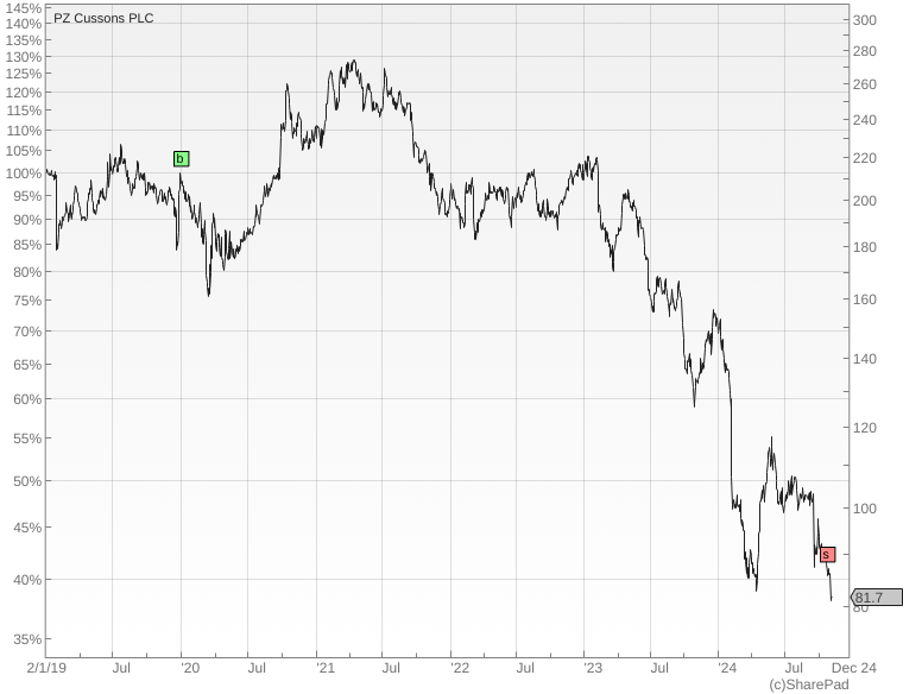
Fortunately, I only added the shares once, in January 2020, when I put £3,878 at risk. Dividends reduced the damage, but SharePad, the software I use to track the portfolio, tells me I lost 46% of the initial investment.
Here is the chart. It spells “P - A - I - N”:

Source: SharePad. “b” indicates when I added the shares to the portfolio, “s” indicates when I removed them.
I should add that, on the eve of the Budget on Tuesday 29 Oct I thought about adding more Thorpe (F W) (LSE:TFW) shares to the portfolio, which I scored highly a week earlier.
FW Thorpe is one of 14 shares in the portfolio listed on the Alternative Investment Market (AIM). One of the attractions of AIM-listed shares is that unlike main market shares they can qualify for an inheritance tax break known as Business Property Relief.
Reducing or abolishing BPR was one of the tax-raising measures open to Chancellor Rachel Reeves in the Budget, and the prospect that she would use it has almost certainly depressed the share prices of companies like FW Thorpe.
In the short term, adding more shares would have been a gamble on the outcome of the Budget. In hindsight, it would have been a winning bet, as BPR was reduced but not abolished and shares like FW Thorpe rallied.
- Budget 2024: AIM shares no longer IHT exempt, and ISA allowance frozen
- Stockwatch: a tax warning for UK and US investors
I had already made my trade for the month and I try to resist the urge to trade twice or more. Sadly, this time I succeeded!
The shares are still good value, so I may have to forget about what might have been and stump up for them when the time comes to trade in November.
Share Sleuth performance
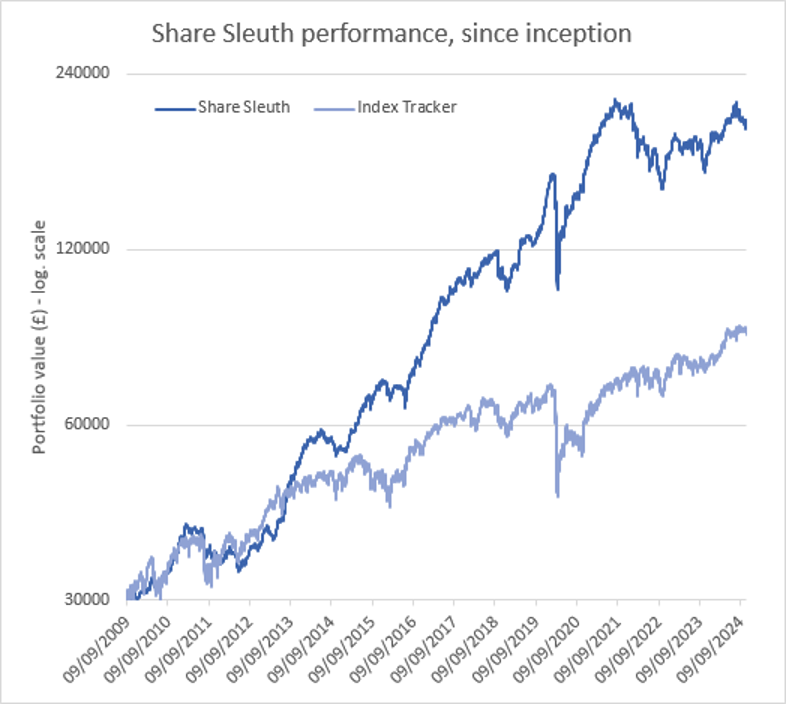
Following the 15th birthday of Share Sleuth on 9 September 2024, we are somewhat belatedly bringing you a more comprehensive statistical overview than usual.
These numbers measure performance over more recent time periods like fund managers do. The numbers were compiled by reader Mark Senior (thanks again, Mark) and checked by me.
As usual, I will not provide much commentary. The performance is a consequence of what’s happened in the stock market and the decisions I have taken.
In the short term, I believe Lady Luck has more sway than my decisions, which are resolutely made for the long term. As the years go by though, I expect my decisions to have more impact and ultimately to determine the performance of the portfolio.
Maybe that’s born out by the numbers. I have sweated for meagre returns in recent years, but the long-term performance is satisfactory.
Here is the cumulative performance of the portfolio for periods starting on 9 September:
Cumulative performance | Share Sleuth | Index tracker |
1 year | 11.92% | 14.80% |
3 years | -5.21% | 23.36% |
5 years | 42.80% | 29.27% |
7 years | 96.01% | 42.26% |
10 years | 252.73% | 74.72% |
12 years | 452.14% | 124.10% |
15 years | 569.48% | 189.27% |
Past performance is not a guide to future performance.
Mark questioned why I use the accumulation units of a FTSE All-Share index tracker as a benchmark when the tracker fund is weighted by market capitalisation and Share Sleuth is predominantly in smaller companies.
A comparison with smaller company indices or funds would be more favourable, but I do not think it is the right way to judge my performance.
I am not compelled to favour smaller companies, I can choose companies of all sizes, which is why Share Sleuth includes the odd big ‘un such as Garmin Ltd (NYSE:GRMN), Auto Trader Group (LSE:AUTO) and Bunzl (LSE:BNZL).
Here are the annualised numbers for periods starting on 9 September:
Annualised performance | Share Sleuth | Index tracker |
1 year | 11.92% | 14.80% |
3 years | -1.77% | 7.25% |
5 years | 10.07% | 5.98% |
7 years | 10.09% | 5.16% |
10 years | 13.43% | 5.74% |
12 years | 15.30% | 6.96% |
15 years | 13.53% | 7.34% |
Past performance is not a guide to future performance.
And here is the performance for each year starting 9 September:
Discrete performance | Share Sleuth | Index tracker |
2009-10 | 11.72% | 13.66% |
2010-11 | 9.58% | 0.09% |
2011-12 | -0.96% | 13.46% |
2012-13 | 30.54% | 18.60% |
2013-14 | 19.91% | 8.15% |
2014-15 | 15.66% | -2.30% |
2015-16 | 12.15% | 12.29% |
2016-17 | 38.72% | 11.95% |
2017-18 | 15.15% | 2.91% |
2018-19 | 5.34% | 3.39% |
2019-20 | 19.61% | -13.17% |
2020-21 | 42.53% | 24.82% |
2021-22 | -22.24% | 3.69% |
2022-23 | 8.92% | 3.63% |
2023-24 | 11.92% | 14.80% |
Past performance is not a guide to future performance.
To bring you bang up to date, at the close on Friday 1 November, Share Sleuth was worth £200,290, 568% more than the £30,000 of pretend money we started with in September 2009.
The same amount invested in accumulation units of a FTSE All-Share index tracking fund would be worth £86,482, an increase of 188%.

Past performance is not a guide to future performance.
After dividends paid during the month from Cohort (LSE:CHRT), Churchill China (LSE:CHH), Macfarlane Group (LSE:MACF), Jet2 Ordinary Shares (LSE:JET2) and Advanced Medical Solutions Group (LSE:AMS), Share Sleuth’s cash pile is £9,684.
The minimum trade size, 2.5% of the portfolio’s value, is £5,007.
Share Sleuth | Cost (£) | Value (£) | Return (%) | ||
Cash | 9,684 | ||||
Shares | 190,607 | ||||
Since 9 September 2009 | 30,000 | 200,290 | 568 | ||
Companies | Shares | Cost (£) | Value (£) | Return (%) | |
AMS | Advanced Medical Solutions | 1,965 | 4,503 | 4,578 | 2 |
ANP | Anpario | 1,124 | 4,057 | 3,541 | -13 |
BMY | Bloomsbury | 845 | 3,203 | 5,898 | 84 |
BNZL | Bunzl | 201 | 4,714 | 6,886 | 46 |
CHH | Churchill China | 1,495 | 17,228 | 12,708 | -26 |
CHRT | Cohort | 1,600 | 3,747 | 14,304 | 282 |
CLBS | Celebrus | 1,528 | 3,509 | 4,202 | 20 |
DWHT | Dewhurst | 938 | 6,754 | 10,318 | 53 |
FOUR | 4Imprint | 116 | 2,251 | 5,962 | 165 |
GAW | Games Workshop | 100 | 4,571 | 12,040 | 163 |
GDWN | Goodwin | 133 | 3,112 | 9,124 | 193 |
GRMN | Garmin | 53 | 4,413 | 8,100 | 84 |
HWDN | Howden Joinery | 1,476 | 10,371 | 12,583 | 21 |
JET2 | Jet2 | 456 | 250 | 6,648 | 2,559 |
LTHM | James Latham | 1,150 | 14,437 | 15,525 | 8 |
MACF | Macfarlane | 3,533 | 5,005 | 3,957 | -21 |
OXIG | Oxford Instruments | 241 | 5,043 | 5,230 | 4 |
PRV | Porvair | 906 | 4,999 | 6,106 | 22 |
QTX | Quartix | 3,285 | 7,296 | 5,470 | -25 |
RSW | Renishaw | 234 | 6,227 | 7,558 | 21 |
RWS | RWS | 2,790 | 9,199 | 4,174 | -55 |
SOLI | Solid State | 1,780 | 1,028 | 4,183 | 307 |
TET | Treatt | 763 | 1,082 | 3,861 | 257 |
TFW | Thorpe (F W) | 2,000 | 2,207 | 7,040 | 219 |
TSTL | Tristel | 750 | 268 | 3,150 | 1,074 |
TUNE | Focusrite | 2,020 | 14,128 | 4,888 | -65 |
VCT | Victrex | 292 | 6,432 | 2,573 | -60 |
Notes
23 October: Removed PZ Cussons
Costs include £10 broker fee, and 0.5% stamp duty where appropriate
Cash earns no interest
Dividends and sale proceeds are credited to the cash balance
£30,000 invested on 9 September 2009 would be worth £200,290 today
£30,000 invested in FTSE All-Share index tracker accumulation units would be worth £86,482 today
Objective: To beat the index tracker handsomely over five-year periods
Source: SharePad, close on Friday 1 November 2024.
Richard Beddard is a freelance contributor and not a direct employee of interactive investor.
Richard owns shares in all the shares in the Share Sleuth portfolio except Tristel.
See our guide to the Decision Engine and the Share Sleuth Portfolio for more information.
Contact Richard Beddard by email: richard@beddard.net or on Twitter: @RichardBeddard
These articles are provided for information purposes only. Occasionally, an opinion about whether to buy or sell a specific investment may be provided by third parties. The content is not intended to be a personal recommendation to buy or sell any financial instrument or product, or to adopt any investment strategy as it is not provided based on an assessment of your investing knowledge and experience, your financial situation or your investment objectives. The value of your investments, and the income derived from them, may go down as well as up. You may not get back all the money that you invest. The investments referred to in this article may not be suitable for all investors, and if in doubt, an investor should seek advice from a qualified investment adviser.
Full performance can be found on the company or index summary page on the interactive investor website. Simply click on the company's or index name highlighted in the article.
Disclosure
We use a combination of fundamental and technical analysis in forming our view as to the valuation and prospects of an investment. Where relevant we have set out those particular matters we think are important in the above article, but further detail can be found here.
Please note that our article on this investment should not be considered to be a regular publication.
Details of all recommendations issued by ii during the previous 12-month period can be found here.
ii adheres to a strict code of conduct. Contributors may hold shares or have other interests in companies included in these portfolios, which could create a conflict of interests. Contributors intending to write about any financial instruments in which they have an interest are required to disclose such interest to ii and in the article itself. ii will at all times consider whether such interest impairs the objectivity of the recommendation.
In addition, individuals involved in the production of investment articles are subject to a personal account dealing restriction, which prevents them from placing a transaction in the specified instrument(s) for a period before and for five working days after such publication. This is to avoid personal interests conflicting with the interests of the recipients of those investment articles.