Renewable energy is a heavily crowded trade, index provider warns
Renewable energy stocks are almost as crowded as small-cap US technology stocks were in 1999.
27th May 2021 11:42
by Tom Bailey from interactive investor
Renewable energy stocks are almost as crowded as small-cap US technology stocks were in 1999.

One of the most popular trades of 2020 was clean and renewable energy companies. For example, one of the most popular buys among UK investors was the iShares Global Clean Energy ETF USD GBP (LSE:INRG), which regularly topped the table of the most-bought exchange-traded funds (ETFs) on interactive investor.
Of course, it wasn’t just interactive investor customers buying. The combined assets under management of both the version available to UK investors (LSE:INRG) and its US-domiciled equivalent surged from just under $800 million (£581 million) at the start of 2020 to almost $11 billion in March 2021. Other clean energy ETFs have seen major inflows, while several new options have launched in recent months.
But according to MSCI, these inflows mean that that clean energy stocks are now heavily “crowded”, drawing parallels with the 1990s dot-com bubble.
- The ETFs Show: what's going on with the iShares Clean Energy ETF?
- The ETFs you can use to help combat climate change
- iShares Clean Energy liquidity fears show wider thematic ETF issue
To determine this, the data provider uses a model that incorporates valuation, trading volume, volatility, momentum and short interest to determine how crowded a stock is. The data provider then compares how many so-called crowded stocks are found within different indices.
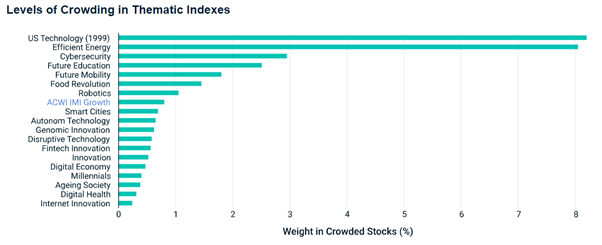
The chart from MSCI below shows the weight of crowded stocks in each of MSCI’s thematic indices. As can be seen, the ‘efficient energy’ thematic index has the highest weighting towards crowded stocks among all contemporary thematic indices.

MSCI notes that most thematic indices were not considerably more crowded than the MSCI ACWI Investable Market Index (IMI) Growth Index, which it uses as a benchmark. This index has a weighting of around 1% in crowded stocks. As the chart shows, several themes have less crowded stock exposure than this index, while several have slightly higher.
However, the efficient energy index stands out for having almost 8% of stocks deemed crowded. In contrast, the second most-crowded thematic index was cybersecurity. This has been a popular theme in the pandemic due to the working-from-home shift. Yet despite this popularity, its crowded stock weighing is still way behind efficient energy.
- Why an equal weight ETF isn’t just a short-term play
- ITM Power: the hydrogen stock’s CEO under the spotlight
- Take control of your retirement planning with our award-winning, low-cost Self-Invested Personal Pension (SIPP)
Most worryingly, however, MSCI’s data shows that the crowded weighting for renewable energy stocks is similar to the level of crowding seen in smaller-cap US technology stocks in 1999, just before the dot-com bubble burst. This is not the first-time commentators have warned of a potential ‘bubble’ in renewable energy stocks.
Indeed, as works such as Daniel Gross’ Pop! Why Bubbles are Great for the Economy show, a bubble often accompanies the advent of exciting new technologies. While this hurts investor returns, it is often good for the spread and adoption of the technology over the longer term. The rise of tech companies in the 2000s and 2010s was made possible by the 1990s dot-com bubble.
However, for investors this is potentially concerning. MSCI is using its own renewable energy index. Popular clean energy products such as iShares Global Clean Energy and Invesco Global Clean Energy (LSE:GCLE) make use of different indices. However, without mentioning names, MSCI also notes that the five largest renewables-themed ETFs by assets under management had a similar weighting in crowded stocks. They note that many of the most crowded stocks were held across multiple funds.
These articles are provided for information purposes only. Occasionally, an opinion about whether to buy or sell a specific investment may be provided by third parties. The content is not intended to be a personal recommendation to buy or sell any financial instrument or product, or to adopt any investment strategy as it is not provided based on an assessment of your investing knowledge and experience, your financial situation or your investment objectives. The value of your investments, and the income derived from them, may go down as well as up. You may not get back all the money that you invest. The investments referred to in this article may not be suitable for all investors, and if in doubt, an investor should seek advice from a qualified investment adviser.
Full performance can be found on the company or index summary page on the interactive investor website. Simply click on the company's or index name highlighted in the article.