Nasdaq index: a masterclass in chart behaviour
30th November 2022 07:20
by Alistair Strang from Trends and Targets
Despite all the negatives investors have to deal with currently, the charts suggest reason for optimism. Independent analyst Alistair Strang explains.

Sometimes, a little extra work is required, taking a “belt & braces” approach to a subject and, currently, the US Nasdaq market is providing a quite amazing masterclass in chart behaviour. Recently, we’ve written at length on how important it can be, when a price or value exceeds the level of a previous trend break.
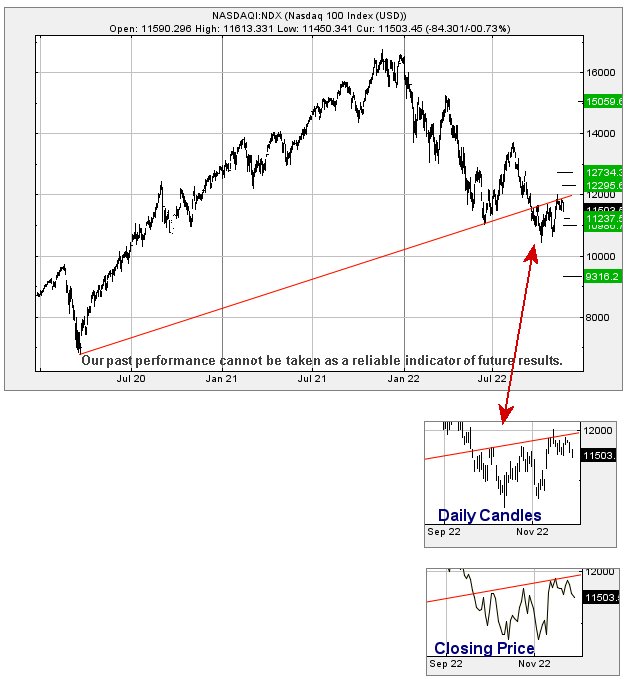
The Nasdaq, presently trading around 11,500, managed this feat in October but essentially has failed to launch. This is rather odd, given Wall Street has been enjoying its own little party and looks capable of continuing the festivities.
- Read about: Free regular investing | Opening a Stocks & Shares ISA | Cashback Offers
For the Nasdaq, the trend break level was identical to the current value of the index, so perhaps we’re witnessing the phenomena of “back testing” (we’re not, the idea is a fallacy). Instead, there’s something rather strange going on, the reasons for which defeats us, but also serves to present an opportunity for a future long position.
The chart below has a couple of extracts, giving Nasdaq price movements since September. For reasons known only to the gods of the market, the Nasdaq has not yet closed above the prior Red trend, instead carefully assigned a place mumbling along just below the Red trend line. This sort of behaviour, while defying logic, comes with a pretty confident promise.
Should the Nasdaq opt to close a session above Red, it’s almost certainly intending to head up. At present, this implies a requirement for the index to close above 11,870 points as a cycle to 12,734 points shall hopefully commence. Any stop loss can usually be extremely tight in this circumstance, so it’s perhaps worth keeping an eye on.
As usual, we can present a converse scenario, one which isn’t particularly exciting as it suggests weakness below 11,600 threatens reversal to 11,237 with secondary, if broken, at 10,986 and ideally a bounce. The index needs below 10,600 to allude the need for running shoes.

Past performance is not a guide to future performance
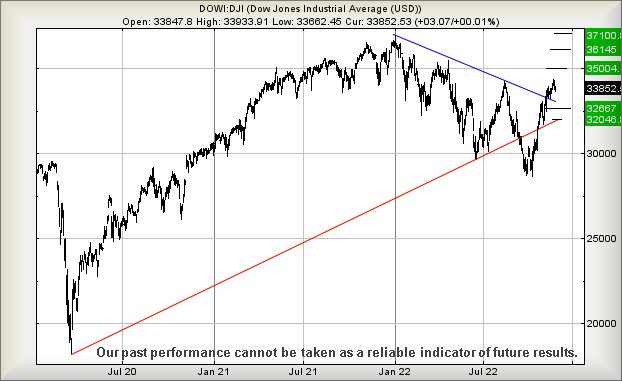
In the chart above, we mentioned it being party time for Wall Street. Some of the numbers are truly impressive as we’re not used to presenting scenarios with 1,000-plus point jump potentials.
Currently, above 34,387 calculates as capable of a lift to 35,000 next with our secondary, if exceeded, working out at 36,145 points. This ambition almost matches the highs experienced by Wall Street at the start of this year and, should the US primary market want to send a message of “everything is rosy”, we can now calculate a third level ambition at an eventual 37,100 points and a new all-time high.
If things intend going wrong for the Dow Jones, closure below 33,300 will serve to give early warning as this risks triggering reversal to an initial 32,667 points with secondary, if broken, at 32,045 points and hopefully a bounce.

Past performance is not a guide to future performance
Alistair Strang has led high-profile and "top secret" software projects since the late 1970s and won the original John Logie Baird Award for inventors and innovators. After the financial crash, he wanted to know "how it worked" with a view to mimicking existing trading formulas and predicting what was coming next. His results speak for themselves as he continually refines the methodology.
Alistair Strang is a freelance contributor and not a direct employee of Interactive Investor. All correspondence is with Alistair Strang, who for these purposes is deemed a third-party supplier. Buying, selling and investing in shares is not without risk. Market and company movement will affect your performance and you may get back less than you invest. Neither Alistair Strang or Interactive Investor will be responsible for any losses that may be incurred as a result of following a trading idea.
These articles are provided for information purposes only. Occasionally, an opinion about whether to buy or sell a specific investment may be provided by third parties. The content is not intended to be a personal recommendation to buy or sell any financial instrument or product, or to adopt any investment strategy as it is not provided based on an assessment of your investing knowledge and experience, your financial situation or your investment objectives. The value of your investments, and the income derived from them, may go down as well as up. You may not get back all the money that you invest. The investments referred to in this article may not be suitable for all investors, and if in doubt, an investor should seek advice from a qualified investment adviser.
Full performance can be found on the company or index summary page on the interactive investor website. Simply click on the company's or index name highlighted in the article.