Merryn Somerset Webb: the scariest chart in the world
29th June 2023 15:30
This terrifying new chart spells trouble, and we’ll all be affected. But there are opportunities, too, and a great chance to lock in nice returns. Columnist Merryn Somerset Webb has some advice for investors.

Not long ago the scariest chart in the world was considered to be that produced by the Bank of England showing that in the wake of the Great Financial Crisis, interest rates had fallen to their lowest in 3,000 years. This was later extended to 5,000 years by the Bank of America, who managed to find some even longer-term data. But either way the message was a strong one. Central banks were doing something no one had ever done before, we were well into unprecedented times – and it was not entirely clear what the consequences would be, or that we would know what they would be within any reasonable time scale.
- Invest with ii: How to Buy Shares| Free Regular Investing | Super 60 Investment Ideas
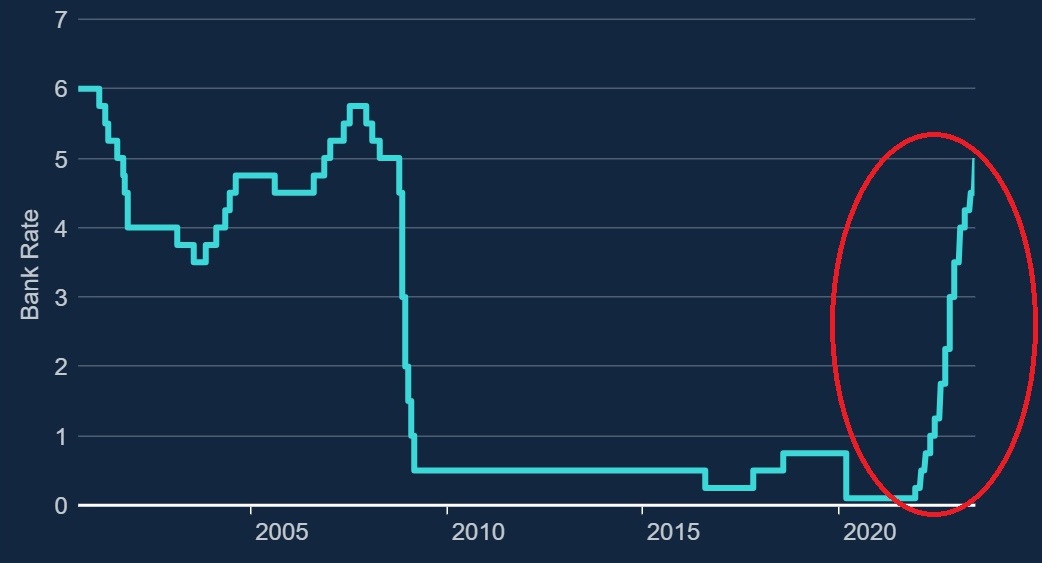
In July 2021, The Bank of America director of global investment strategy noted that at some point in the next 5,000 years, rates would rise again but that “there is no fear on Wall Street that this happens any time soon.” We seemed to be rubbing along perfectly well with very low interest rates and there was nothing much to worry about. Unprecedented... but also fine. Whoops. A mere two years later, there is a new scariest chart in town: the one that shows those 5,000-year lows in interest rates ending and being replaced with one of the fastest rises in interest rates in history.

Source: Bank of England
In December 2021 the Bank of England started to put interests up and in late June the UK base rate hit 5% - from its low of 0.1%. That’s a 50-fold increase in 18 months – and comes with an expectation that rates will peak at around 6%. And the consequences are beginning to make themselves clear in the form of bond market disruption, equity market volatility, mortgage mayhem and rising concerns about global recession.
What next? The only answer likely to be correct at this point is volatility – everything else is more guessing than forecasting. There are also sorts of medium-term drivers of structural inflation around the world at the moment. The drive to net zero is expensive. The retreat from globalisation is pushing up labour and supply chain costs across the board. The new cold and hot wars add expensive friction to every part of the global economy. It is also true that historically it has proven exceptionally hard to get inflation back down to 2% once it has gone above 8%.
- Investors expecting to make returns comfortably ahead of inflation in 2023
- Cash or shares? What the data tells us about where to invest
Research from Rob Arnott at Research Affiliates shows that in the cases in developed countries where this has happened it has taken an average of 14 years for inflation to return to target. Nasty. Overall, warns the Bank for International Settlements (the BIS is one of the few global organisations with a reasonable forecasting record), there is now a strong risk that we are moving into a world in which inflation – driven by workers making perfectly reasonable demands for pay rises to meet rising prices – becomes “entrenched.”

In a recent interactive investor webinar discussing how to invest in these increasingly strange times, Paola Binns of Royal London Asset Management pointed out that the UK has a particularly acute shortage of labour (and so is particularly vulnerable to this kind of wage price spiral).
To hold that risk off says the BIS, “interest rates may need to stay higher for longer than the public and investors expect.” That said there is also every chance that in the short term at least inflation will fall sharply. Modern central banks are not much minded to look at the money supply number. If however they were to, they would note that since March 2021, when the Bank of England started printing money and shoving it directly into people’s pockets (rather than trying to do it via the banking system), money supply in the UK (as defined by M4ex) has risen around 20%, as has our consumer price index (CPI).
With that in mind, they might also note that, according to data from The MacroStrategy Partnership, it is down 3.5% on an annualised basis over seven months. Add that to the sharp fall in PPI input and output inflation seen in the last set of numbers from the Bank of England (down to 0.5% and 2.9% from peaks of 24.4% and 19.6% in mid 2022) and you can see why some economists are beginning to think the Bank of England should take a break from putting up interest rates to see what happens next. None of this is easy.
What does all this mean for your investments? The good news (of which there is precious little) first. If you hold cash savings, you are finally making an income from them. The days when the best accounts were offering 0.1% are long gone. Today you can get at least 4% on an easy access account and a good 5% if you are prepared to lock your money up.
- Are ‘dividend hero’ investment trusts keeping up with inflation?
- Fund Battle: Polar Capital Technology vs Allianz Technology
- How to prepare your portfolio for the new era of spikeflation
On to the bad news. That isn’t anywhere near enough to compensate for inflation. The value of your cash savings will still be falling in real terms. But it isn’t as bad as it used to be (we must count our blessings). There is also good news when it comes to money market funds: one of the more popular funds on the interactive investor website this year has been the Royal London Short Term Money Market fund which yields 4.6% - something most investors would have barely dared to dream of even a year ago.
Still, making sure you are getting the best possible returns on cash is only part of the answer. The last few decades have been characterised by a phenomenal bull market in bonds (when interest rates fall bond prices rise) and one that has done a nice job of steading portfolios along the way: when the equity market went into free fall in March 2000 for example, the bond market did well, and those with 60/40 portfolios did just fine. That turned around nastily last year when both equities and bonds fell simultaneously – if you held a portfolio of bonds, a portfolio of equities or a combined portfolio you would have been pleased to only lose 20% on it!
But that doesn’t mean you should shy away from the bond market now. If there is even a reasonable chance that inflation will fall – if not to 2% but to even 4%, says Binns, now is a great chance to lock in some nice returns on bonds: the yield on a 10-year UK gilt is now around 4.3% and that on the two year is well over 5%. You have not been able to lock in those kinds of returns for a good 15 years. Look at it like that and this is a “pretty exciting time for savers,” said Fidelity’s Charlotte Harrington on the same interactive investor webinar.
- Bonds vs equities: where should income-seekers turn?
- Benstead on Bonds: what pros who think inflation is here to stay are buying
- Fixed income trades surge 879%
It might be an even more exciting time for investors in some areas of the equity market. Bonds might still provide some ballast to a portfolio but their long-term history is not always one of delivering real returns – and if inflation does not fall back as expected in the medium term they won’t deliver them now either. Data from Deutsche Bank shows us that in six of the 12 decades since 1900, US government bonds have provided negative real returns, for example.
With that, and the words from the BIS in mind, we must look to equity markets as well. One thing history also tells us is that equities can offer a pretty good defence against inflation, but only if they are cheap at the beginning of the inflationary episode. For those prepared to invest in the UK, that suggests opportunity. UK equities are not only cheap pretty much across the board (think a 40% discount to US equities) but they tend to offer reasonable dividend yields – which are both a hedge against falling equity markets and inflation – as well.
Look at the kinds of things that interactive investor clients are buying, and you can see they get this. According to deputy collectives editor Sam Benstead, UK investor portfolios are filling up with not just gilts on 5% but the likes of Aviva (LSE:AV.), BP (LSE:BP.), Rio Tinto (LSE:RIO) and Lloyds Banking Group (LSE:LLOY) on similar yields. There is also a commendable rush for some of the big investment trusts with reasonable yields – think Murray International (LSE:MYI), Alliance Trust (LSE:ATST) and City of London (LSE:CTY).
There will definitely be trouble ahead. It isn’t possible for interest rates to go from the lowest in history to historically normal levels and beyond in less than two years without there being some very unpleasant side effects. But buy cheap, look for dividends, lock in yields, constantly expect the unexpected and you should be fine - in the long term at least.
Merryn Somerset Webb is a senior columnist for Bloomberg. Previously, she was editor-in-chief of MoneyWeek and a contributing editor at the Financial Times. She is also a non-executive director of several UK-listed investment trusts and an attendee to the interactive investor investment committee.
These articles are provided for information purposes only. Occasionally, an opinion about whether to buy or sell a specific investment may be provided by third parties. The content is not intended to be a personal recommendation to buy or sell any financial instrument or product, or to adopt any investment strategy as it is not provided based on an assessment of your investing knowledge and experience, your financial situation or your investment objectives. The value of your investments, and the income derived from them, may go down as well as up. You may not get back all the money that you invest. The investments referred to in this article may not be suitable for all investors, and if in doubt, an investor should seek advice from a qualified investment adviser.
Full performance can be found on the company or index summary page on the interactive investor website. Simply click on the company's or index name highlighted in the article.